Our favorite music genres- from different perspectives
For decades “the charts” have been the arbiter of consumer tastes in music. That makes sense. What’s selling (in CD days) or what’s streaming (today) lubricates the engine of the music industry. The charts drive revenue allocation and help to sort out the winners when it comes to fan appeal. Some pundits cite the streaming charts and conclude that the entire country is listening to Rap/Hip-Hop. Look at the Spotify Top 50 for any week, and you’ll see a list dominated by R&B/Hip-Hop artists. Boomers might argue that the last great album was Fleetwood Mac’s eponymous release- in 1975. Surveys asking music fans about the genres that they listen to and like the most don’t always align with the charts. Read on and you’ll see that there are very good reasons for this. The key takeaway- use all the tools at your disposal when you profile music fans.
What the charts say
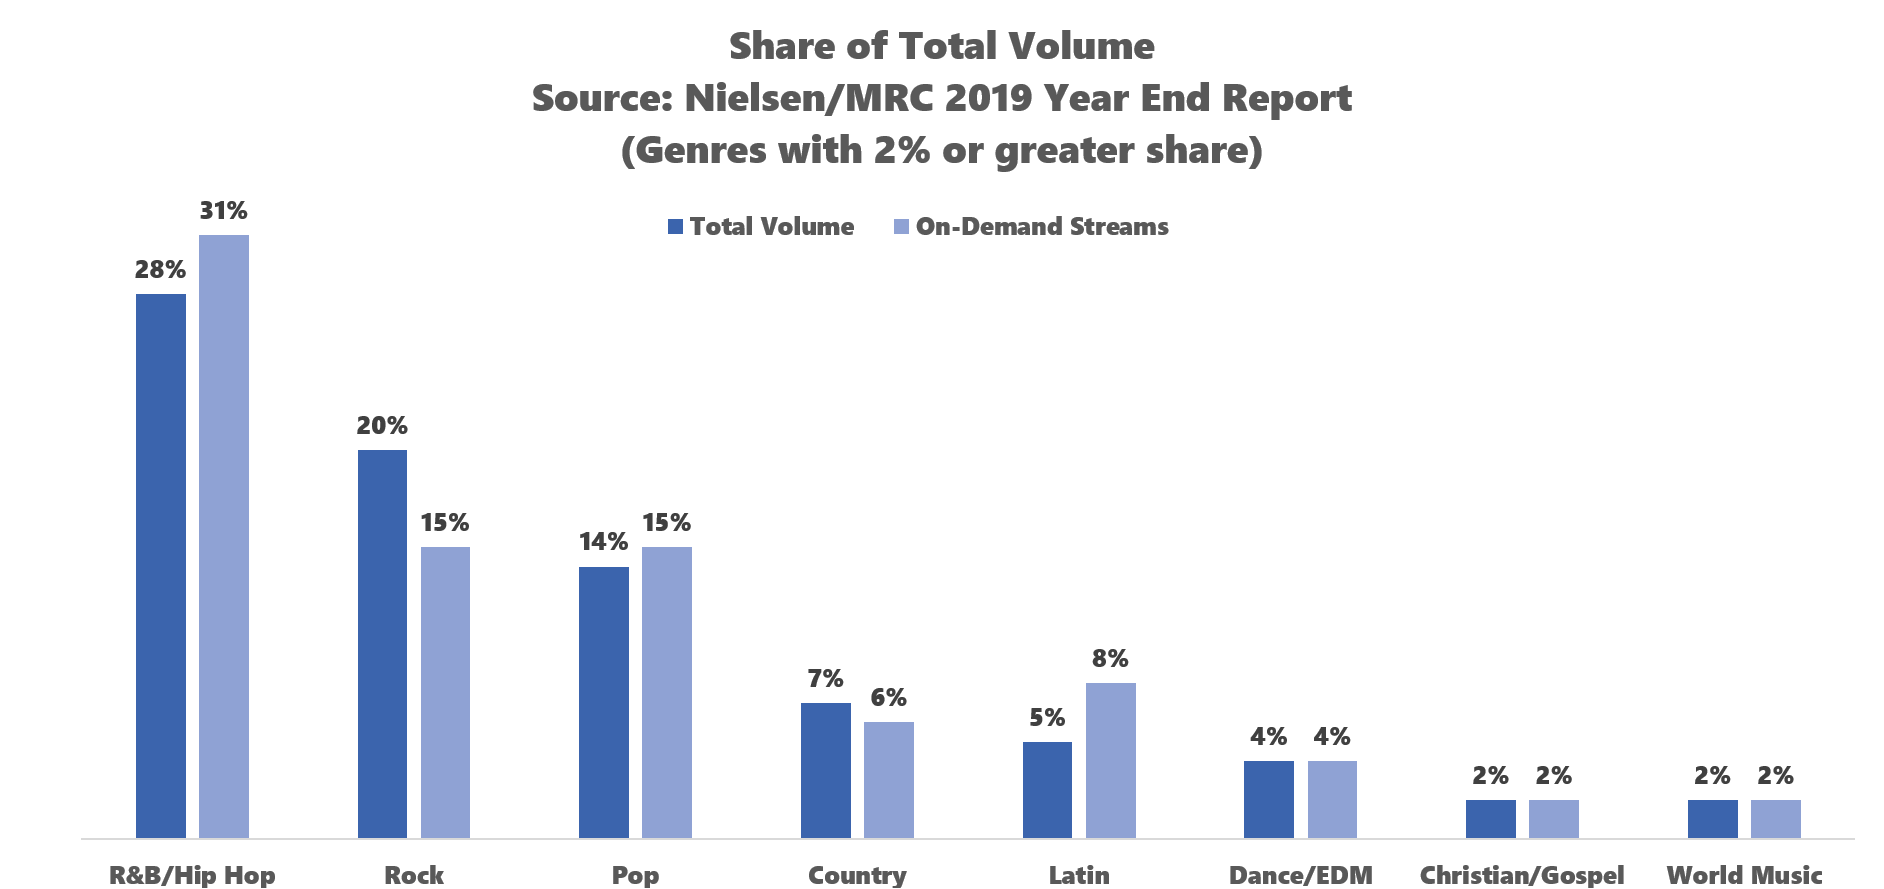
Nielsen Music publishes a year-end summary with a wealth of data, including the top music formats and genres https://www.billboard.com/p/nielsen-music-mrc-datas-us-year-end-2019-report-us . The chart below shows Nielsen’s Share of Total Volume, which calculates “album sales” based on a formula of physical and digital sales, and on-demand streams. The R&B/Hip-Hop category dominates the Nielsen charts, which are published by its sister company Billboard. Rock is way more important to physical and digital download sales, but because these formats are in decline, on-demand tends to influence the charts.
Survey says!
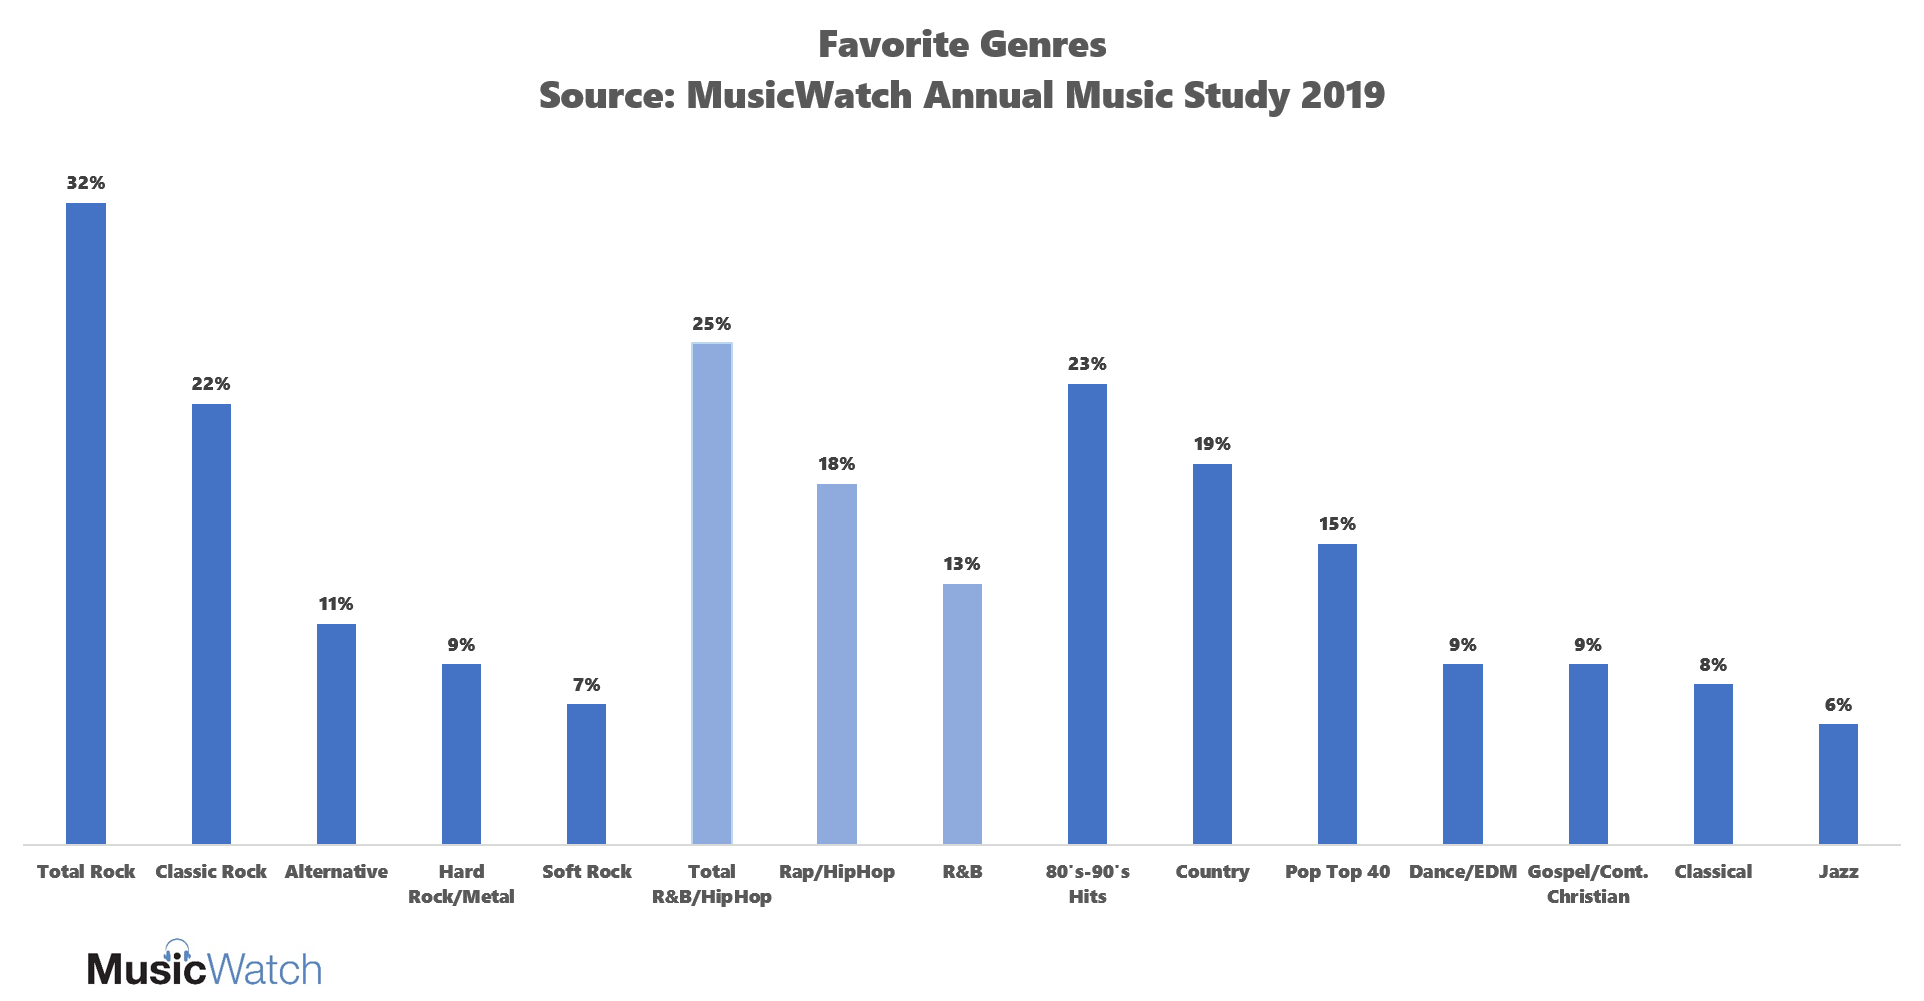
Each year MusicWatch asks consumers what music genres they regularly listen to, and which are their “favorites.” Favorites are genres that we listen to and purchase (the Nielsen categories) but also go to see live, track on social media, or buy merchandise. The MusicWatch categories are more detailed than what is shown in the Nielsen report, but Rock tops Rap as America’s “favorite” genre.
There are several factors that explain the difference between what tops the charts, and “favorites”.
The way we listen
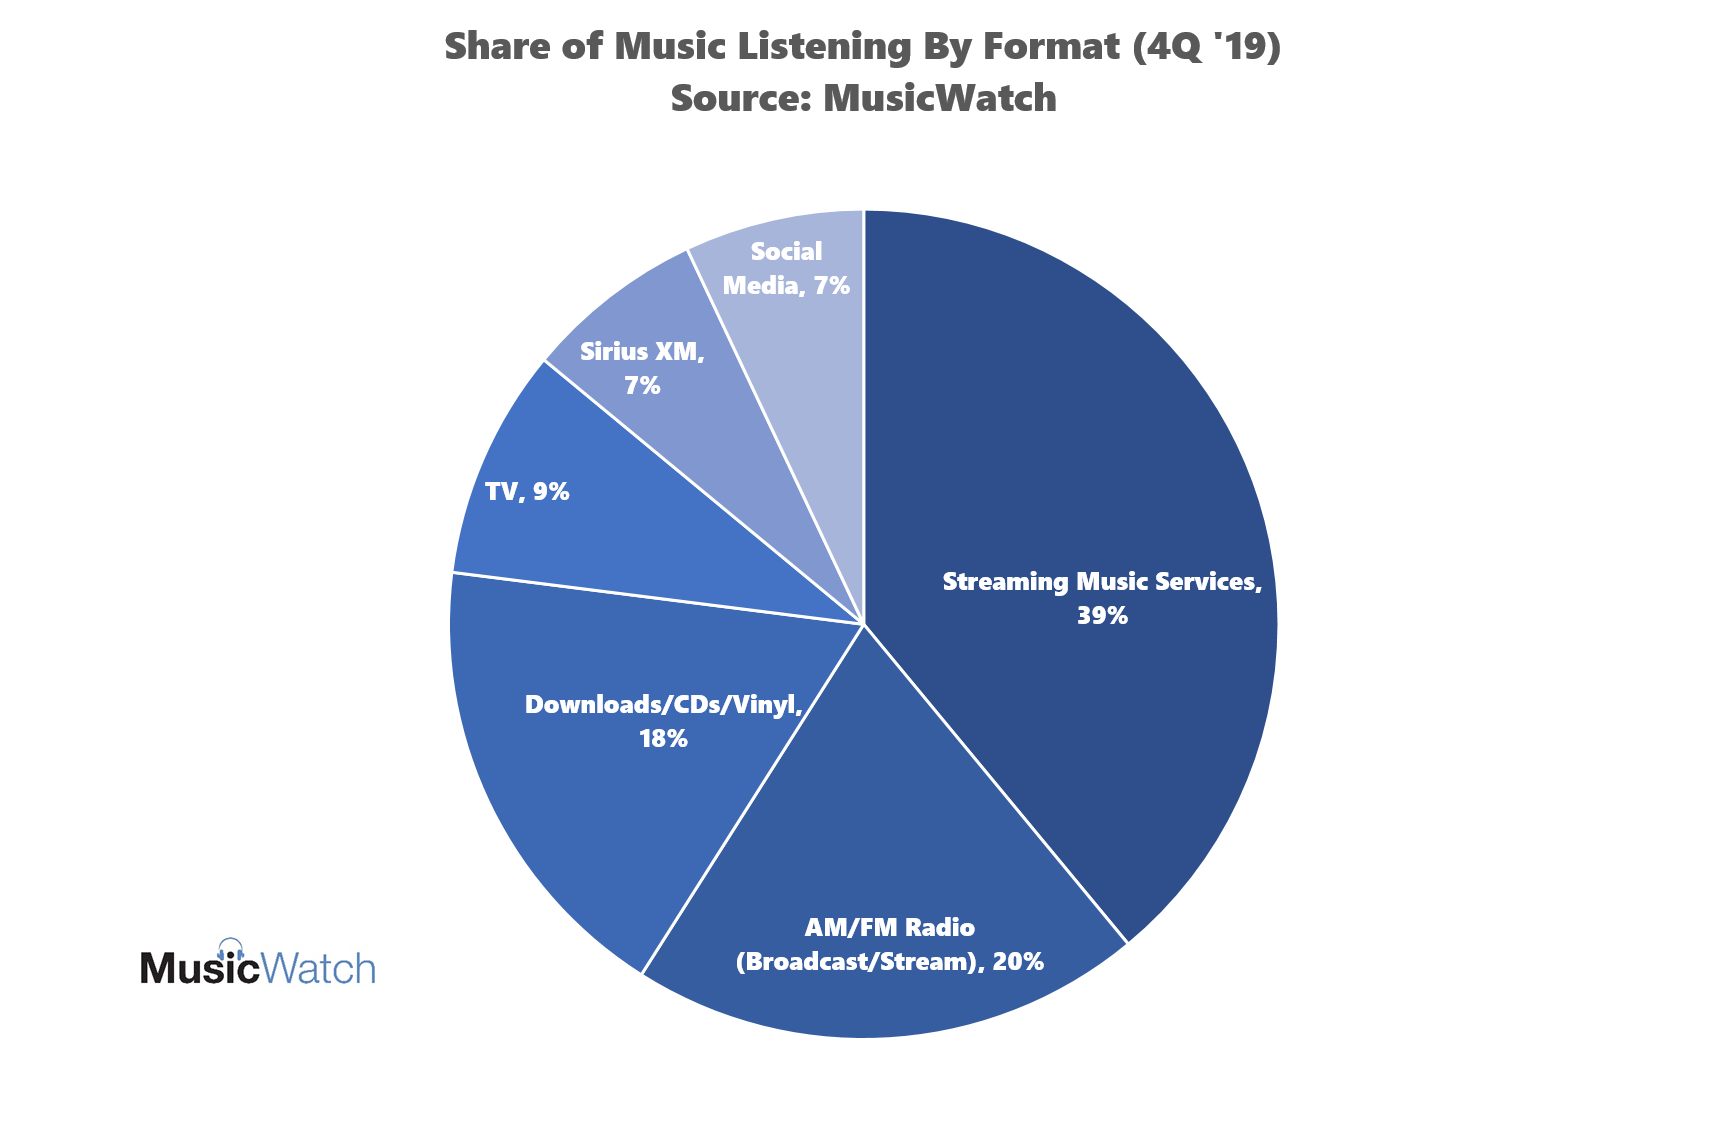
On-demand streaming is becoming a powerhouse, with nearly 140 million listeners in the U.S. last year. As shown below, streaming accounts for 39% of our weekly listening and that includes interactive (e.g. not on-demand) services such as Pandora. But we also listen to music on broadcast radio, and on SiriusXM satellite radio. Nielsen points out that 6 of 10 of the top radio artists during the past decade were Country artists. Then there are our collections. We may not buy much anymore, but tens of millions of fans regularly listen to their CDs and iTunes downloads. The music genres that we consider our favorites are reflected in this diverse music consumption.
Charts are influenced by heavy listeners
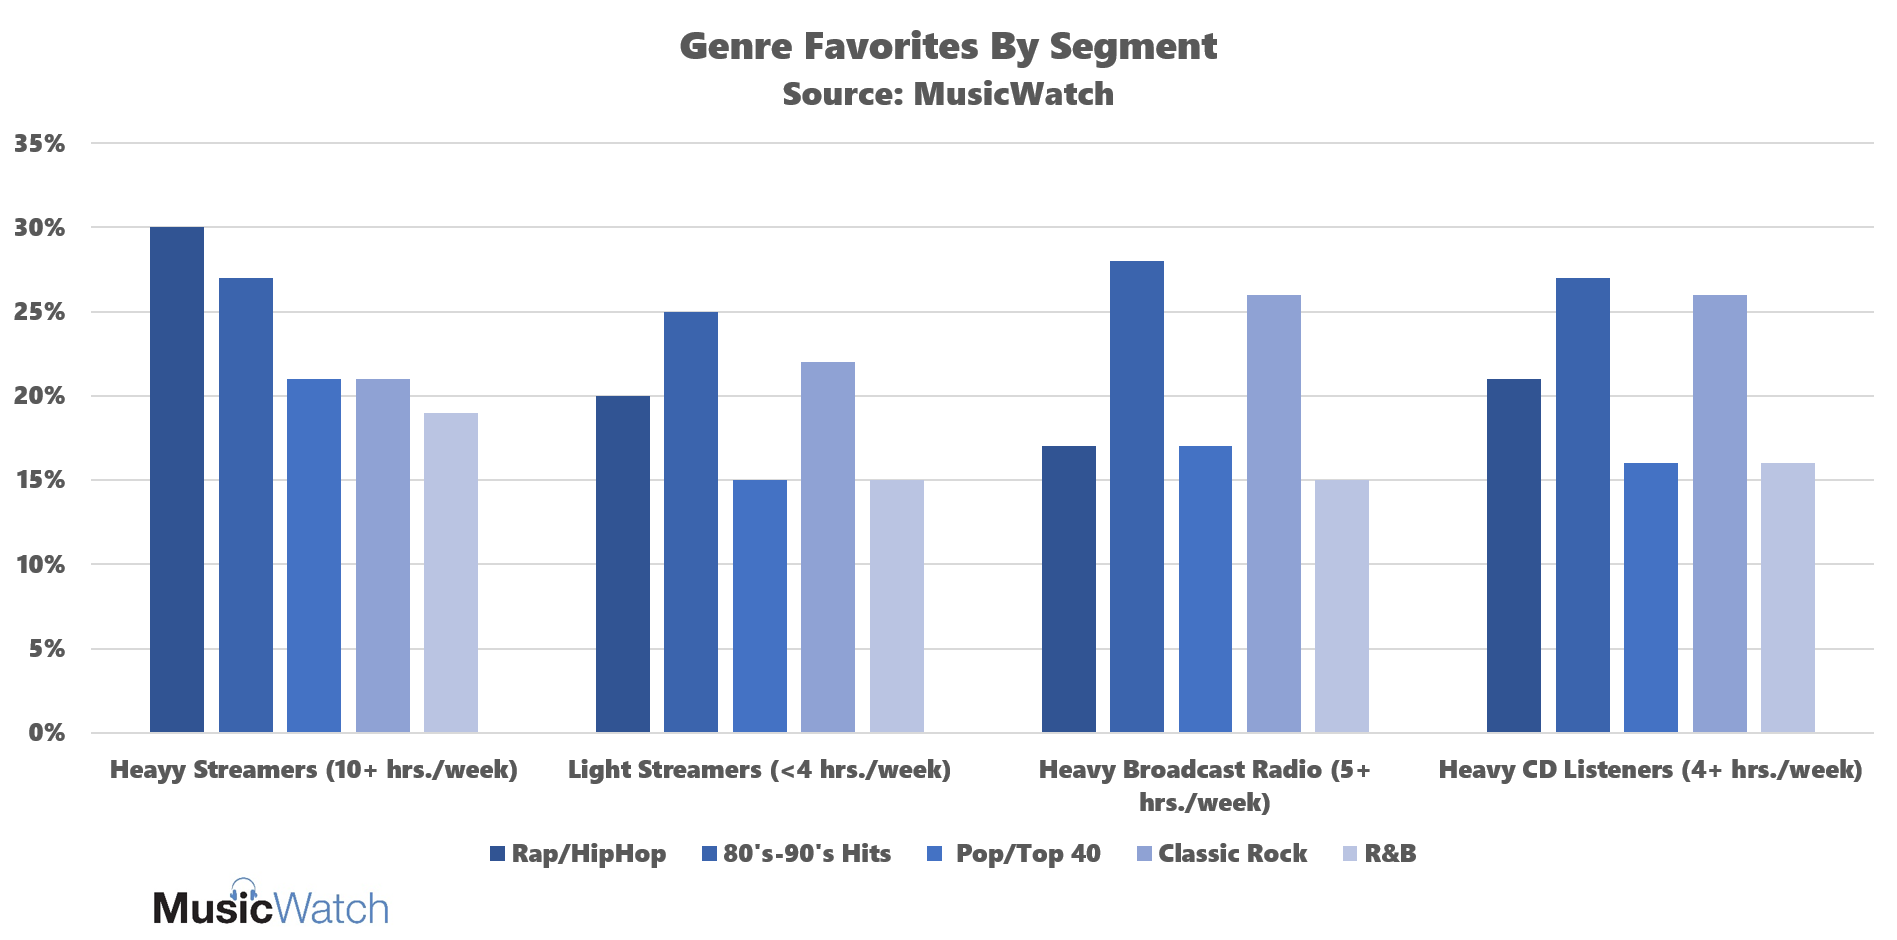
Charts aren’t democratic; these days they are influenced by heavy listeners to on-demand streaming services. Not surprisingly, heavy listeners who spend 10 or more hours streaming each week are more likely to cite Rap/HipHop as their favorite genre. Light streamers prefer 80’s-90’s Hits and Classic Rock. The preferences of light streamers are very similar to those of heavy listeners of music on broadcast AM/FM radio, and heavy CD listeners. Radio is the most popular music format for in-car listeners. Age is a big factor in determining who is a heavy user of each of these formats.
 .
.
Soundtracks of our lives
Research has shown that our music tastes are mostly baked in by the time we reach age 30. So it’s not surprising that favorite genres vary depending on the era in which you grew up. The music industry often uses the phrase “Soundtracks of our lives” to describe this. Think of your first concert, the music posters in your room, a prom theme, or your wedding song. Even though we often cross genres when listening, these findings should not be a surprise:
- Gen Z claim R&B/HipHop as their favorite by a 2:1 margin over Rock (43% vs. 20%)
- Millennials associate with hits from the 80’s-90’s (28% favorite), then HipHop (25%) and Country (21%)
- Gen X prefer Rock and 80’s-90’s Hits by a 2:1 margin over R&B/HipHop
- Boomers favor Rock, mostly Classic Rock, and hits from the 50’s-70’s.
Popular culture treasures youth. But Gen X and Boomers account for half of the adult internet-using population. Their tastes matter. They are critical in driving revenue for live music, and account for a good portion of royalties that Sirius and Pandora contribute to artists.
The Convergence of Like, Live and Merch
You may have bought that CD of “Dark Side of the Moon” in 1985, but folks are still buying Pink Floyd t-shirts. The four favorite genres among music merchandise buyers are Classic Rock, 80’s-90’s Hits, Rap/HipHop and Country, in that order. atVenu, a live event commerce platform (back when we had live events), reports that t-shirts are the top selling event merch, with K-Pop, Pop and Hard Rock accounting for the highest per head sales- Rap/HipHop ranks #11 in average dollars per head (atVenu).
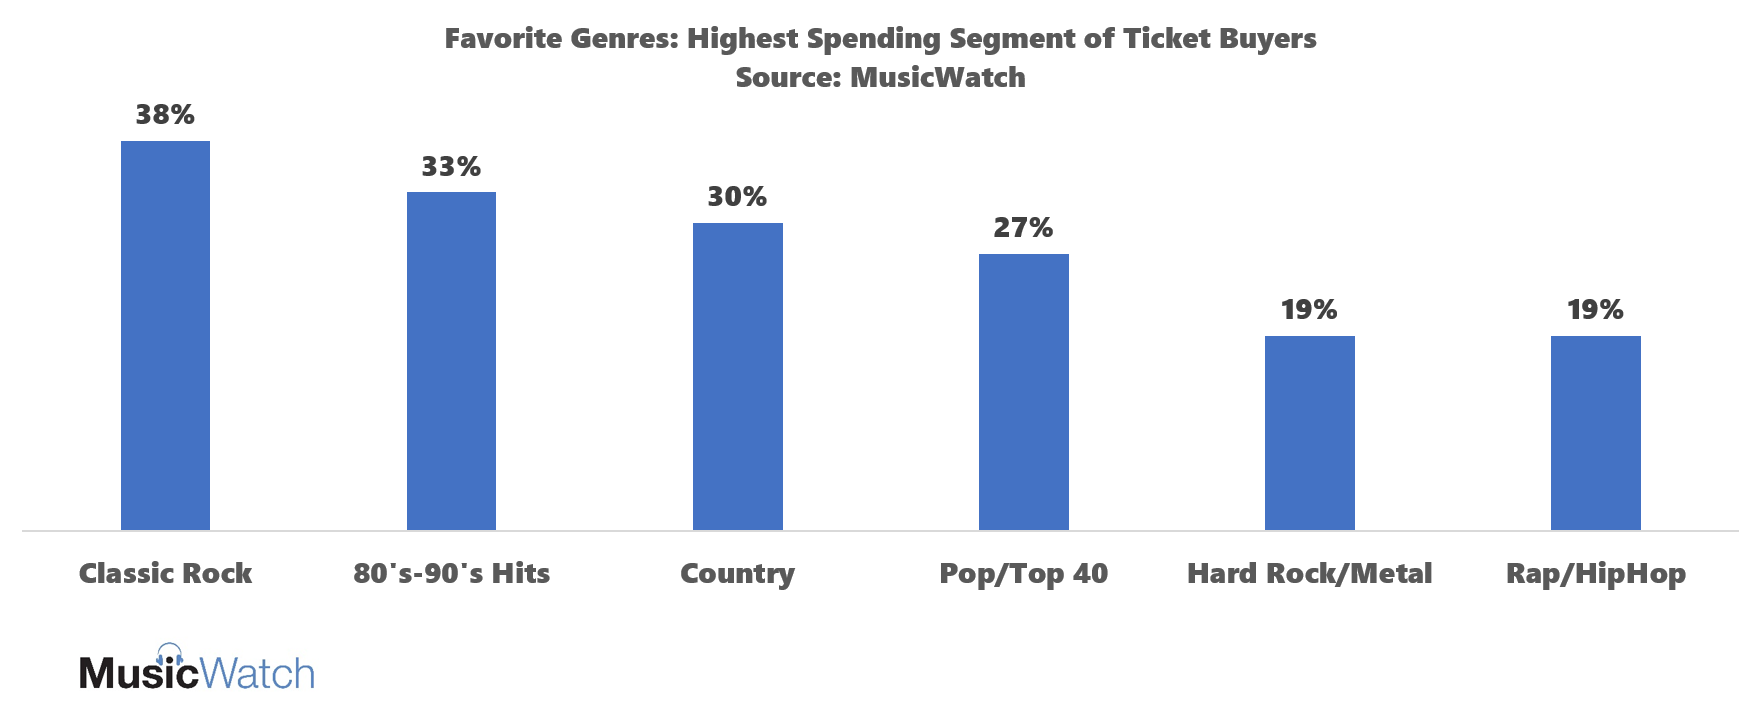
On the live side, heavy spenders on tickets to live events favor Classic Rock over Rap/HipHop by a 2:1 advantage. In 2019, the ticket side of the U.S. live music business drove nearly $8B in revenue, contrasted to $11B for recorded music*.
Considering that touring and merch account for a large portion of artist’s livelihoods it is vital to understand which genres are tops among big spenders.
*Sources: Live tickets, Soundchart from PWC/Citi estimates; Recorded Music from RIAA- both 2019
New and emerging touchpoints for fans
There was a time when you expressed fanship by listening on the radio, buying CDs and going to shows. Today we have podcasts about music, podcasts featuring music, and TikTok. There is music in video games and music in gaming apps. Seven out of ten Americans use social media to relate to artists and live events; 29 percent regularly listen to music on social apps. Each of these outlets represent another touchpoint for fans to bond with “the soundtracks of their lives”.
Charts are the currency of the music business. It’s been nearly 30 years since the start of the “SoundScan era,” which used retail sales of CDs and cassettes to revolutionize how the charts were created. The charts have evolved to the new reality, where streaming accounts for 80% of US recorded music revenue (RIAA). Even as streaming comes to dominate how we listen, fans have a myriad of other options for connecting with their favorite music. To truly understand the DNA of music fans, we’ve got to think beyond the charts.
thebookthiefpdfVat on said:
Markus Zusak has created a masterpiece that resonates with readers of all ages. For those who prefer reading on tablets or laptops, locating The Book Thief in PDF format allows for easy access to this emotional journey. Dive into the lives of the residents of Himmel Street today. https://thebookthiefpdf.site/ The Book Thief Novel Pdf Download
Read The Book Thief Pdf on said:
The description of the air raids is terrifyingly real. Read The Book Thief PDF to feel the fear of the cellar. It puts you right there with the characters, holding your breath as the bombs fall, a testament to the power of the writing.
bravenewworldpdfVat on said:
The Savage chooses the right to be unhappy. The Brave New World PDF records his choice. It is the most human act in the entire novel. https://bravenewworldpdf.site/ Read Brave New World Online Pdf
Brave New World Study Guide Pdf on said:
Huxley’s novel is a masterpiece of world-building. The Brave New World PDF contains all the details of this intricate society. From the games to the government, everything is designed to support the theme of control.
littlewomenpdfVat on said:
For educators and homeschoolers, this novel is a staple of the curriculum. It offers rich discussions on history, ethics, and literature. To facilitate learning, a digital text is very useful. A Little Women PDF allows students to search for keywords, analyze themes, and write papers with ease. It is a modern tool for teaching a classic text, ensuring that the next generation appreciates the genius of Louisa May Alcott just as much as the last. https://littlewomenpdf.site/ Little Women Character Analysis Pdf
thepearlpdfVat on said:
Throughout the narrative, the environment reflects Kino’s internal struggle. The sea, once a source of life, becomes a place of danger. The desert is a place of purgatory. The mountains are the site of judgment. Literary geographers might use the pearl pdf to map out Kino’s physical and spiritual journey. The movement from the coast to the high interior mirrors the escalation of the stakes. Every step away from the sea is a step further into the trap of his own making. https://thepearlpdf.site/ Read The Pearl Pdf
thepearlpdfVat on said:
Ultimately, “The Pearl” is about the loss of innocence. Kino begins the story in a state of naive contentment and ends it with the heavy burden of experience. The pearl opens his eyes to the world’s cruelty, effectively expelling him from his personal Eden. This theme of expulsion is universal. Whether read for a class or for personal growth, the story resonates. Obtaining the pearl pdf is often the method of choice for book clubs discussing these heavy themes. It provokes discussion on what we truly value and what we are willing to sacrifice to get it. https://thepearlpdf.site/ The Pearl Teacher Guide Pdf
littlewomenpdfVat on said:
The journey of Meg, Jo, Beth, and Amy from childhood to womanhood is a story that demands to be read and re-read. It is a comforting reminder that while times change, the core emotions of growing up remain the same. To keep this story close at hand, many readers look for a Little Women PDF download. This format is perfect for the modern lifestyle, allowing you to dive back into the 1860s whenever you have a spare moment. Whether for a book club or personal enjoyment, having the digital file ensures that the wisdom of the March women is always accessible. https://littlewomenpdf.site/ Kafka The Little Woman Pdf
thestrangerpdfVat on said:
The character of Meursault has fascinated readers for generations. Is he autistic, sociopathic, or simply honest? The Stranger by Albert Camus leaves the interpretation open. If you are searching for The Stranger PDF, you are engaging with a text that refuses to label its protagonist. It invites you to look at the world through eyes that see only what is physically there, without the filter of social expectation. https://thestrangerpdf.site/ The Stranger Online Pdf
Heart Of Darkness Text Pdf Download on said:
Marlow’s journey is often interpreted as a descent into hell. The stations he passes are like circles of suffering. This allegorical reading adds another layer of depth to the story. If you are interested in this interpretation, a Heart of Darkness PDF can help you track the religious and mythological references in the text. The book is a profound spiritual inquiry disguised as an adventure story. It is a work that speaks to the soul.
The Pearl By John Steinbeck Pdf Download on said:
The role of religion and superstition in the novella adds another layer of complexity. Kino and Juana balance their Catholic faith with ancient beliefs, praying to both God and the old gods for luck. This syncretism is depicted with respect but also shows the desperation of the characters. If you are exploring the cultural context of the story, searching for the pearl pdf can help you locate passages detailing their prayers and rituals. It highlights the uncertainty of their lives, where survival depends as much on luck and faith as it does on skill and hard work.
The Stranger Camus Pdf Download on said:
The concept of the “Outsider” is perfectly encapsulated in Meursault. He does not play the game of society. He does not grieve when he should, nor does he love when expected. The Stranger by Albert Camus is a stunning examination of what happens when a man is honest about his indifference. Readers searching for the PDF of this novel often find themselves questioning their own social performances. It is a book that demands to be read closely, offering a new perspective on authenticity and the judicial system.
Little Women Novel Part 1 Pdf on said:
The story of four sisters growing up during the American Civil War remains one of the most widely read novels in literary history. It is a narrative rich with lessons about love, sacrifice, and the importance of family bonds in the face of adversity. Modern readers often find that accessing the book electronically helps them study the intricate character development and themes more closely. If you are looking to explore the world of the March family, finding a Little Women PDF online is an excellent way to start. This format ensures that you can enjoy Alcott’s beautiful prose on your tablet, e-reader, or laptop at any time.
Steinbeck The Pearl Full Pdf on said:
The rifle that Kino desires is a symbol of power and violence. He believes it will grant him respect and safety, but in the tragic irony typical of Steinbeck, the only shot fired in the book kills the very thing he wanted to protect. This irony is the heartbeat of the story. Readers looking to understand literary irony often turn to the pearl pdf. The rifle does not bring freedom; it brings death. It challenges the notion that weapons or force can secure a future, suggesting instead that they only invite more tragedy.
Summary And Analysis Of Heart Of Darkness Pdf on said:
The sheer density of the imagery in this book is astounding. Light does not always mean good, and darkness does not always mean evil. Conrad subverts these traditional symbols to create a more complex moral landscape. A Heart of Darkness PDF is the perfect tool for unraveling these symbolic knots. The novella is a rich tapestry of meaning that requires careful attention. It is a book that challenges you to think deeply about the nature of good and evil.
The Stranger Pdf Maman on said:
Ultimately, The Stranger is a book about freedom. Meursault finds freedom in prison, and freedom in the face of death. Albert Camus suggests that realizing life is absurd is the first step to true liberty. If you are searching for a digital version or PDF, this novel is a guide to existential thought. It is a story that encourages you to live fully in the present, acknowledging that the end is the same for everyone.
Little Women Five Forever Sheetmusic Pdf Free on said:
Revisiting the March family home is like visiting old friends who always welcome you with open arms. The trials and tribulations of the sisters, set against the backdrop of a divided nation, offer a poignant look at resilience. If you are eager to introduce this story to a new generation, or simply want to enjoy it yourself, a digital edition is a great choice. You can easily find a Little Women PDF to read on a variety of devices. This flexibility ensures that the legacy of Louisa May Alcott continues to thrive in the digital era, reaching readers everywhere.
رواية Heart Of Darkness Pdf on said:
From the first page to the last, the atmosphere of the novella is one of brooding unease. Conrad uses the setting to mirror the internal state of the characters. The isolation of the jungle brings out the true nature of the men who enter it. A Heart of Darkness PDF is essential for readers who want to analyze the text’s use of pathetic fallacy and symbolism. The story is a gripping psychological thriller that serves as a warning about the dangers of unchecked ambition and the fragility of civilization.
Pdf Camus The Stranger on said:
The prose of Albert Camus is deceptive; it seems simple, but it carries the weight of the world. The Stranger tells the story of an ordinary man who commits an extraordinary crime. The lack of motive is what disturbs the reader and the characters within the book. If you are searching for a digital text or PDF, this novel provides a fascinating look at the psychology of indifference. Meursault is a character who refuses to fake emotions he does not feel, regardless of the cost.
Themes Of The Pearl Pdf on said:
Kino’s canoe is described as the one thing that guarantees a man can feed his family; it is his legacy and his livelihood. When the canoe is destroyed by those envious of the pearl, it is an attack on Kino’s very identity. This act of vandalism strikes a chord with readers who understand the value of work and heritage. Literature circles discussing this book often utilize the pearl pdf to read these specific passages aloud. The destruction of the canoe symbolizes the total alienation of Kino from his community and his past, forcing him onto a path from which there is no return.
greatbigbeautifullVat on said:
Great Big Beautiful Life is a story about finding your way. Emily Henry writes with a wisdom that is guiding. The epub edition is the companion you need on your own journey. It is a great way to access this beautiful advice. The story is inspiring and real. This is a book that can change your life. Get the digital copy and find your path. https://greatbigbeautifullifeepub.site/ Great Big Beautiful Life Emily Henry Epub Vk
thisbookwillburymeVat on said:
Sometimes a book comes along that feels like a physical force. This Book Will Bury Me by Ashley Winstead has that kind of power. It is a narrative that overwhelms you with its brilliance. The epub edition is perfect for readers who want instant gratification. You can download it and start reading in seconds. The story is fast-paced and full of surprises, making it a perfect fit for digital reading. If you want a book that will bury you in its brilliance, this is it. Don’t wait another minute to experience this story. https://thisbookwillburymeepub.site/ This Book Will Bury Me Synopsis
greatbigbeautifullVat on said:
Experience the craft of a bestseller with Great Big Beautiful Life. Emily Henry is a professional at the top of her game. The epub format allows you to study her technique. It is a great, big, masterclass in writing. The narrative is beautiful and structured. This is a life story that is well-told. Download the ebook and appreciate the skill. https://greatbigbeautifullifeepub.site/ Great Big Beautiful Life Emily Henry
thisbookwillburymeVat on said:
Sometimes a book comes along that feels like a physical force. This Book Will Bury Me by Ashley Winstead has that kind of power. It is a narrative that overwhelms you with its brilliance. The epub edition is perfect for readers who want instant gratification. You can download it and start reading in seconds. The story is fast-paced and full of surprises, making it a perfect fit for digital reading. If you want a book that will bury you in its brilliance, this is it. Don’t wait another minute to experience this story. https://thisbookwillburymeepub.site/ This Book Will Bury Me
thelasthousewifeepVat on said:
For those who enjoy dark academia mixed with a psychological thriller, this narrative delivers on every level. The story follows Shay and a podcaster as they unravel the mystery behind a friend’s death. Finding a digital copy or an epub of The Last Housewife allows you to dive straight into the action. Winstead writes with a ferocious intensity that keeps you glued to the screen. It is a disturbing yet necessary look at misogyny and survival. Make sure you have time set aside, because once you start reading, you will not want to put it down. https://thelasthousewifeepub.site/ The Last Housewife Ending Explained
shieldofsparrowsepVat on said:
Devney Perry has outdone herself with Shield of Sparrows. The epub format is the best way to experience this book. It allows for instant access and easy reading. Perry’s narrative is compelling and emotional. The digital edition is perfect for reading on the go. Whether you have a few minutes or a few hours, this ebook is a great companion. Download it now and see what the hype is about. https://shieldofsparrowsepub.site/ Shield Of Sparrows Pdf
Great Big Beautiful Life Audiobook on said:
Unlock a world of emotion with the latest sensation in contemporary fiction. Great Big Beautiful Life creates a landscape of feelings that is both familiar and excitingly new. Emily Henry’s writing shines in this latest installment, and reading it as an epub enhances the experience with the convenience of digital features. Whether you are highlighting poignant passages or searching for specific terms, the ebook version is versatile and user-friendly. This is a story about the grandeur of living and the beauty of loving. It is an essential addition to any digital library. Grab your copy today and find out why everyone is raving about this spectacular novel.
The Last Housewife Chapter 1 on said:
If you want a book that will keep you guessing until the very last page, pick this one up. The mystery of the cult and the murder is woven together expertly. The The Last Housewife epub is widely sought after by fans of suspense. The characters are rich and fully realized, making the stakes feel personal. It is a story about the long shadow of trauma and the light of justice. Prepare to be captivated.
What Is Odessa In Shield Of Sparrows on said:
The literary landscape is brighter with Shield of Sparrows by Devney Perry. To enjoy this book to the fullest, find the shield of sparrows epub for your collection. Digital reading is the future, offering unparalleled access to great stories instantly. This novel is a testament to Perry’s skill in crafting deeply emotional narratives. Whether you are a fast reader or one who savors every word, the ebook format adapts to your pace. Don’t miss out on this trending title; secure your digital edition and get ready to be swept off your feet.
Emily Henry Great Big Beautiful Life Paperback on said:
Experience the grandeur of Great Big Beautiful Life. Emily Henry writes a story that is epic in scope. The epub format allows you to hold this epic in your hand. It is a great, big, magnificent story. The narrative is beautiful and vast. This is a life story that is larger than life. Download the ebook and witness the greatness.
The Last Housewife Page Count on said:
Shay Deroy is a survivor, but can she be a savior? This is the central question of this intense thriller. The The Last Housewife epub is a great choice for e-book lovers. The plot is tight and suspenseful. It is a story about the enduring power of friendship. Winstead has written a book that is both exciting and emotional.
Shield Of Sparrows Pdf Free on said:
For a reading experience that fits your lifestyle, choose the digital version of Shield of Sparrows by Devney Perry. The epub file is easy to download and works on almost all devices. This novel is a stunning addition to the romance genre, offering depth and excitement. Perry has a unique voice that resonates with readers, and this book is a prime example. The portability of the ebook means you can take the story with you on all your adventures. Don’t miss out on this incredible read; add it to your digital collection.
lejournaldunprisonVat on said:
L’ancien président signe ici son livre le plus personnel et le plus risqué. C’est un acte de foi en sa propre innocence. La disponibilité en epub du journal d’un prisonnier rend ce témoignage accessible à tous. Sarkozy y parle avec le cœur, sans langue de bois, de l’épreuve qu’il traverse. Un récit qui marquera l’histoire politique de la France. https://lejournaldunprisonnierepub.site/ Le.journal D’un Prisonnier
lejournaldunprisonVat on said:
Ce témoignage est une pièce d’histoire. Nicolas Sarkozy y écrit sa légende. La version epub du journal d’un prisonnier est accessible. L’ancien président y montre sa force de caractère. Une lecture indispensable. https://lejournaldunprisonnierepub.site/ Livre Le Journal D Un Prisonnier Sarkozy
shortstoriesingermVat on said:
Many learners struggle to find the bridge between textbook dialogues and real German media. A search for a short stories in German PDF often yields mixed results. The “Short Stories in German for Beginners” book serves as that perfect bridge. It uses simplified language that still sounds natural and authentic. You get to see how sentences are constructed in real narratives, not just in isolated examples. This exposure helps you internalize grammar rules without explicitly studying them. By reading regularly, you will find that your ability to understand spoken German also improves, as your brain gets used to the flow of the language. https://shortstoriesingermanpdf.site/ Short Stories In German For Beginners – Olly Richards Pdf
betterthantheprompVat on said:
In the world of YA romance, finding a book that feels unique can be a challenge. Better Than the Prom stands out with its sharp dialogue and relatable characters. If you are searching for the PDF, you are looking for a high-quality reading experience. Lynn Painter understands the teenage mind and writes about insecurities and dreams with great empathy. Liz’s journey is one of self-discovery as much as it is about romance, making it a fulfilling read on multiple levels. https://betterthantheprompdf.site/ When Is Better Than The Prom Coming Out
Le.boyfriend Freida on said:
Les apparences sont souvent trompeuses, mais dans “Le Boyfriend”, elles sont mortelles. Freida McFadden nous offre un récit où le danger est partout. Ce thriller est parfait pour être lu en format epub, où que vous soyez. L’histoire est captivante, avec un rythme soutenu et des personnages inoubliables. Si vous aimez les livres qui vous surprennent à chaque chapitre, vous allez adorer celui-ci. Une lecture numérique qui vous laissera sans voix.
Better Than The Prom Español on said:
For anyone who loves the “she fell first but he fell harder” vibe, or perhaps the other way around, this book is essential reading. Better Than the Prom by Lynn Painter explores the nuances of friendship turning into romance. If you are typing keywords like better than the prom pdf into your search bar, you are looking for a convenient way to access this gem. It’s a quick, engaging read that will have you smiling at your screen. The character growth is fantastic, making it a top pick for YA enthusiasts.
Avis Livre Le Boyfriend Freida Mcfadden on said:
La perfection est un piège mortel dans “Le Boyfriend”. Freida McFadden nous offre un récit glaçant sur les apparences trompeuses. Ce livre en format epub est une excellente addition à toute bibliothèque numérique. L’intrigue est ficelée avec intelligence, vous laissant deviner la suite sans jamais vraiment savoir. C’est une lecture addictive qui explore les coins les plus sombres de l’âme humaine.
Le Journal D'un Prisonnier Sarko on said:
L’ancien président face à l’histoire. Ce livre est un rendez-vous manqué avec la justice mais réussi avec les lecteurs. Le format epub du journal d’un prisonnier est un succès. Nicolas Sarkozy y livre ses convictions. Un témoignage essentiel.
Short Stories In German Intermediate Pdf on said:
Fluency comes from exposure, and nothing provides better exposure than reading. While you could scour the internet for a disjointed short stories in German PDF, a cohesive book provides a structured path to improvement. “Short Stories in German for Beginners” covers a wide variety of genres, ensuring you learn vocabulary for different situations. The controlled language allows you to guess meanings from context, a vital skill for any language learner. This mimics the way we learn our native language. Stop analyzing every grammar rule and start enjoying the language through the power of storytelling.
unavitacometantepdVat on said:
Il successo planetario di Hanya Yanagihara non è casuale: ha creato un universo narrativo dove l’amore e la sofferenza danzano insieme in modo straziante. Per chi preferisce la lettura digitale, trovare Una vita come tante in PDF o ePub rappresenta il modo ideale per gestire la mole imponente del volume cartaceo. Potrai sottolineare le frasi più toccanti e rileggere i passaggi fondamentali ovunque ti trovi. Scopri come la vita di Jude St. Francis, segnata da traumi indicibili, si intreccia con quella dei suoi amici Willem, JB e Malcolm. Non perdere l’opportunità di leggere uno dei romanzi più discussi del decennio. https://unavitacometantepdf.site/ Una Vita Come Tante Sellerio
igiornidelleternitVat on said:
I giorni dell’eternità è un romanzo che vi terrà svegli la notte. Ken Follett mescola abilmente suspense e storia in un mix esplosivo. Il formato epub è l’alleato perfetto per le vostre sessioni di lettura notturna o in viaggio. La leggerezza del file digitale contrasta con la densità della trama, rendendo l’esperienza piacevole. Un finale epico per una saga che ha fatto sognare milioni di lettori, ora a vostra disposizione in versione elettronica. https://igiornidelleternitaepub.site/ I Giorni Dell’eternità Pdf Gratis Download
ilpiccoloprincipepVat on said:
Riscoprire questo testo da adulti è un’esperienza completamente diversa rispetto alla lettura fatta da bambini, perché si colgono sfumature di malinconia e saggezza prima invisibili. La ricerca di il piccolo principe pdf è spesso mossa dalla voglia di rileggere quel passaggio preciso che ci aveva colpito anni fa. La storia ci insegna che l’autorità deve essere ragionevole per essere rispettata, come dice il Re, e che bisogna esigere da ciascuno quello che ciascuno può dare, una lezione di leadership e di vita di grande valore. https://ilpiccoloprincipepdf.site/ Il Piccolo Principe Riadattato Per Bambini Pdf
unavitacometantepdVat on said:
Un romanzo che è un atto d’amore verso i propri personaggi, anche nel dolore. Una vita come tante è disponibile in versione digitale per chi cerca il PDF o l’ePub. La storia di un’amicizia che sfida il tempo è raccontata magistralmente da Hanya Yanagihara. Avere il libro sul proprio dispositivo significa poter leggere in ogni momento libero, lasciandosi trasportare dalle emozioni. Non perdere l’opportunità di leggere uno dei libri più importanti degli ultimi anni, capace di cambiare la tua visione del mondo. https://unavitacometantepdf.site/ Una Vita Come Tante Autrice
lultimosegretopdfVat on said:
La caccia alla verità continua in “L’ultimo segreto”. Robert Langdon non si ferma davanti a nulla. La scelta del pdf è ottima. La narrazione è veloce e ricca di colpi di scena. Se ami i thriller, questo libro è imperdibile. https://lultimosegretopdf.site/ L’ultimo Segreto Di Lady Diana Pdf
igiornidelleternitVat on said:
Non c’è modo migliore di comprendere la Guerra Fredda che attraverso le pagine di I giorni dell’eternità. Ken Follett ci offre un punto di vista privilegiato sui grandi eventi che hanno scosso il mondo. L’epub è il formato ideale per chi vuole avere questo capolavoro sempre a portata di mano. La lettura digitale vi permetterà di seguire le trame complesse e i numerosi personaggi con facilità. Un libro che vi arricchirà e vi terrà compagnia per lungo tempo. https://igiornidelleternitaepub.site/ Ebook Pdf Mobi Epub I Giorni Dell’eternità
Il Piccolo Principe Storia Intera Pdf on said:
L’incontro tra l’aviatore e il piccolo viaggiatore interstellare è una delle allegorie più potenti della letteratura mondiale, un racconto che non smette mai di insegnare qualcosa di nuovo a ogni rilettura. Per chi ama la comodità della tecnologia, avere a disposizione il piccolo principe in pdf significa poter consultare le citazioni più celebri in qualsiasi momento, magari durante un viaggio in treno o una pausa caffè. La storia ci insegna che siamo responsabili per sempre di ciò che abbiamo addomesticato, una lezione di vita che risuona forte in un’epoca in cui i rapporti umani sembrano farsi sempre più effimeri e superficiali.
Una Vita Come Tante Frasi Più Belle on said:
Ogni pagina di questo romanzo è una ferita e una carezza allo stesso tempo. Se sei interessato a leggere Una vita come tante, magari cercando una versione PDF per il tuo e-reader, sappi che stai per affrontare uno dei libri più discussi del secolo. La trama complessa e i personaggi tridimensionali richiedono tempo e attenzione, cose che il formato digitale facilita enormemente. Segui le vite intrecciate di Willem, Jude, Malcolm e JB mentre navigano le acque turbolente dell’età adulta a New York. Un capolavoro moderno che aspetta solo di essere letto e vissuto intensamente.
L Ultimo Segreto Di Dan Brown Trama on said:
La verità è più strana della finzione in “L’ultimo segreto”. Robert Langdon lo scoprirà a sue spese. La versione pdf è perfetta per i lettori digitali. La narrazione è incalzante e ricca di dettagli. Se cerchi un thriller che ti catturi, questo è il libro che fa per te.
Una Vita Come Tante Come Muore Jude on said:
La storia di un dolore che non si può dire, ma che si deve leggere. Una vita come tante è il romanzo del secolo. Se cerchi il PDF, sei pronto a scoprire il segreto di Jude. La comodità del formato digitale ti accompagnerà in questa lettura intensa e commovente. Hanya Yanagihara ha creato un mondo narrativo unico, dove l’amicizia è l’unica luce nel buio. Scegli l’eBook per immergerti in questa storia straordinaria e lasciati trasportare dalle emozioni più vere.
Dan Brown L'ultimo Segreto Pdf Gratis on said:
Se pensavi di aver visto tutto, “L’ultimo segreto” ti farà ricredere. Robert Langdon è coinvolto in un’indagine che lo porterà ai confini della conoscenza umana. Il file pdf del libro è ideale per chi vuole leggere in qualsiasi momento della giornata. La storia è un susseguirsi di eventi drammatici e rivelazioni scioccanti. Se ami i thriller che non danno tregua, questo è il romanzo che devi assolutamente leggere.
Il Piccolo Principe Francese Pdf on said:
La bellezza di questo libro sta nel suo essere un compagno silenzioso che sa parlare al momento giusto, offrendo conforto e prospettive diverse sulle difficoltà della vita. Avere a disposizione il testo in formato elettronico, cercando magari il piccolo principe pdf, significa poter rileggere quel passaggio preferito proprio quando se ne ha più bisogno. La volpe che insegna il rito e l’attesa ci ricorda che la felicità va costruita con pazienza e che il tempo dedicato agli altri è ciò che rende la vita degna di essere vissuta e ricordata.
hauntingadelinepdfVat on said:
Parsons Manor is a character in its own right. It watches, it waits, it knows. The search for the Haunting Adeline PDF is a search for its secrets. The book is a masterclass in atmospheric writing. It is a story that will transport you to a world of gothic horror. It is a novel that will haunt your dreams. https://hauntingadelinepdf.site/ Haunting Adeline Book Pdf Download
mockingjaypdfVat on said:
As the squad infiltrates the Capitol, the city itself becomes an arena filled with deadly pods and mutts. The action sequences are breathless and terrifying, showcasing Collins’ ability to write thrilling combat. A Mockingjay PDF is the best way to carry this adrenaline-fueled story with you. No matter where you are, you can open the file and be transported to the dangerous streets of the Capitol. The emotional payoff of the trilogy is immense and unforgettable. Make sure you have the digital edition to experience it fully. https://mockingjaypdf.site/ Hunger Games Mockingjay Pdf Whole Book
everythinginevertoVat on said:
The structure of the novel, moving between the past and the present, creates a sense of inevitability. We know Lydia dies, but we hope against hope that she can be saved. This dramatic irony makes the reading experience intense. If you are looking for the Everything I Never Told You PDF, be prepared for a story that pulls you in and doesn’t let go. It is a masterfully constructed narrative that reveals the chain reaction of events leading to the tragedy. https://everythinginevertoldyoupdf.site/ Everything I Never Told You Celeste Pdf
mockingjaypdfVat on said:
The layout of the Capitol is designed to confuse and kill, making it the ultimate arena. The squad’s journey through it is a masterclass in tension and action. A Mockingjay PDF lets you trace their path through the city. Digital maps and text are clear and easy to follow on high-quality screens. The setting is a character in itself, dangerous and beautiful. survive the city to win the war. https://mockingjaypdf.site/ Mockingjay Novel Pdf Indonesia
empireofstormspdfVat on said:
The return to Terrasen is not the homecoming Aelin expected, and she must fight for every inch of ground. The narrative explores the concept of home and what it means to belong. Searching for an Empire of Storms PDF is the first step to joining Aelin on this difficult journey. The book challenges the reader’s expectations at every turn. It is a bold, ambitious novel that succeeds on every level. https://empireofstormspdf.site/ Empire Of Storms Pdf Download Free
Everything I Never Told You By Celeste Ng Pdf on said:
“Lydia is dead.” These three words begin a journey into the heart of a family that has been keeping secrets for decades. Celeste Ng’s storytelling is masterful, revealing the truth layer by layer. If you are looking for the Everything I Never Told You PDF to read this compelling story, you will find yourself immersed in 1970s America. The book touches on the isolation of being the “other” and the desperate need for connection. It is a story about the things we cannot say, and how they eventually consume us.
Haunting Adeline Chapter 8 Pdf on said:
Parsons Manor holds the key to a century-old mystery. Adeline is the only one who can unlock it. But she is being watched by a man who wants to unlock her. If you are looking for the Haunting Adeline PDF, you are in for a treat. The book is a masterclass in atmospheric storytelling. It is a story that will chill you to the bone while setting your heart on fire. It is a unique blend of genres that works perfectly.
Empire Of Storms Mobi on said:
The evolution of Aelin from an assassin to a queen is one of the most compelling arcs in modern YA fantasy. In this specific installment, she must balance her terrifying power with the responsibilities of leadership. Readers frequently look for the Empire of Storms PDF to analyze the intricate foreshadowing hidden within the text. The dialogue is sharp, witty, and often heartbreaking. Every page turns the screw of tension tighter until the explosive finale leaves you breathless.
Haunting Adeline Book Epub on said:
The line between love and obsession is thin. Zade crosses it repeatedly. Adeline has to decide if she wants to cross it with him. The demand for the Haunting Adeline PDF is a testament to the gripping nature of this dilemma. The book is a psychological thriller that doubles as a romance. It is a story that will mess with your mind and your heart. It is a book that you won’t be able to put down.
Mockingjay Ebook Free Download Epub on said:
Gale’s military strategies are effective but ruthless, causing a rift with Katniss. The book explores the ethics of “the ends justify the means.” Read about this conflict in the Mockingjay PDF. The digital format allows you to pause and think about the moral dilemmas presented. It is a book that asks you to pick a side. The answer is never simple.
Shadow Of The Queen Pdf on said:
As the story progresses, the lines between good and evil become blurred, only to be sharply redefined. The choices the characters make define them more than their bloodlines. A Queen of Shadows pdf offers a nuanced look at morality in war. Sometimes good people must do terrible things to survive. The book does not shy away from the grey areas of conflict. It asks difficult questions about what is justifiable in the name of freedom.
Kingdom Of Ash Pdf Once Upon A Book on said:
Nox Owen makes a return, reminding us of how far the story has come since the glass castle. These callbacks to the first book are a treat for long-time fans. To catch all the easter eggs, a searchable kingdom of ash pdf is incredibly handy. The series comes full circle, honoring its roots while expanding its horizon. It is a celebration of the entire journey, rewarding those who paid attention to the details.
The Road Cormac Epub Mccarthy Torrent on said:
Cormac McCarthy’s The Road is a book about the basics of existence. Food, fire, shoes. These are the things that matter in the post-apocalyptic world. The father and son’s struggle is riveting. This novel is widely read and discussed. Many people look for the pdf format to keep the book on their devices. It is a story that resonates with readers of all ages.
Pdf Beloved Book on said:
The “roaring” in Sethe’s head is a symptom of her trauma. To trace the silencing of this noise, a Beloved PDF is useful. It stops when Beloved arrives. A digital text helps readers map the correlation between the ghost’s presence and Sethe’s mental state, illustrating how the physical manifestation of her guilt paradoxically brings her a temporary peace before the chaos ensues, a nuance that is critical for understanding her character’s motivation.
Sarah J Maas Kingdom Of Ash Pdf Download on said:
Sarah J. Maas wraps up the romantic arcs with heat and heart. The “mate” bond is explained and solidified for several couples. Romance lovers need the kingdom of ash pdf. The love scenes are integral to the plot, reinforcing what the characters are fighting for. It is romantic fantasy at its absolute peak.
Beloved Chapter 8 Pdf on said:
Music and song play a crucial role in the healing process within the novel. A Beloved PDF allows readers to locate the lyrics and hums scattered throughout the text. These songs often carry the history that cannot be spoken in plain words. By utilizing an electronic format, readers can easily reference these musical interludes, understanding them as a form of communication that transcends the limitations of language and connects the characters to their African roots.
Descargar Queen Of Shadows Epub on said:
The concept of “Yielding” introduced in the witch storyline is a powerful moment of sacrifice and power. It expands the magical lore significantly. A Queen of Shadows pdf captures the awe of this magic. The witches are not just villains; they are a complex culture with their own codes of honor. This anthropological approach to world-building makes Erilea feel vast and diverse. There are many cultures and many ways of life, all clashing in this war.
wutheringheightspdVat on said:
Sometimes you just want to read a good ghost story. While it is a romance, a Wuthering Heights PDF delivers plenty of scares. The opening chapters with Lockwood’s nightmare are genuinely frightening. The ambiguity of the supernatural elements keeps you guessing. Is it a ghost or a hallucination? The digital format is perfect for reading these spooky sections in the dark. It is a genre-bending novel that satisfies the craving for horror and romance simultaneously, making it a versatile addition to your digital reading collection. https://wutheringheightspdf.site/ Wuthering Heights Pdf File Download
eastofedenpdfVat on said:
One of the central themes of the book is the Hebrew concept of timshel, which translates to “thou mayest,” implying that mankind has the choice to conquer sin. This powerful message is woven throughout the narrative of the Trask family. Students often rush to find an East of Eden PDF online to quickly reference Lee’s explanation of this concept for their essays. We have curated a space that discusses this philosophy in detail, helping readers connect the biblical parallels to the fictional events in the Salinas Valley. It is an essential companion for anyone delving into the electronic version of this classic saga. https://eastofedenpdf.site/ East Of Eden John Steinbeck Pdf Download
prideandprejudicepVat on said:
Scholars often discuss the feminism inherent in Austen’s work. Elizabeth Bennet is an agent of her own destiny. To explore these themes, a close reading is required. A digital copy allows for easy referencing of key passages. If you are searching for a Pride and Prejudice PDF, you may be interested in gender studies. Our platform supports this academic perspective. Discover how Austen challenged the status quo of her time. https://prideandprejudicepdf.site/ Pride And Prejudice Novel Pdf Free
eastofedenpdfVat on said:
The contrast between the fertile land and the dry years mirrors the fortunes of the families involved. It is a story of cycles – of nature and of man. Environmental literature scholars find much to analyze here. Using an East of Eden PDF makes keyword searching for environmental terms efficient. Our content explores the ecological aspects of the novel, discussing how the land dictates the lives of the characters. We offer a unique angle on the text, appealing to those interested in the intersection of nature and literature. https://eastofedenpdf.site/ East Of Eden Filetype Pdf
betterthanthemovieVat on said:
For fans of classic rom-coms who want to see those tropes played out in a fresh and witty way, this young adult novel is a must-read. Wes Bennett and Liz Buxbaum have a chemistry that sizzles off the page, making every argument and tender moment feel incredibly real. Many readers prefer a digital format to binge-read this delight, so searching for a high-quality PDF version is a common step. The narrative proves that sometimes the best love stories are the ones we never scripted for ourselves, offering a plot that is truly better than the movies. https://betterthanthemoviespdf.site/ Better Than The Movies Online Pdf
prideandprejudicepVat on said:
Why wait for a delivery when you can read instantly? Digital books are immediate. If you want to start reading now, a digital file is best. A Pride and Prejudice PDF is just a click away. Our website offers this immediacy. We value your time and your desire to read. Start the first chapter within seconds. https://prideandprejudicepdf.site/ Pride And Prejudice Hidden Lusts Pdf
eastofedenpdfVat on said:
One cannot discuss this book without mentioning the frighteningly realistic portrayal of sociopathy in Cathy Ames. Her ability to manipulate those around her is chilling. Psychology enthusiasts often read the book as a case study. Having access to an East of Eden PDF allows for a focused reading of her chapters. Our platform dissects her actions and motives, asking the difficult questions about nature versus nurture. We provide a safe space to discuss the darker elements of the book, adding depth to your psychological analysis of the characters. https://eastofedenpdf.site/ East Of Eden Chapter 38 Pdf
wutheringheightspdVat on said:
The supernatural elements in the novel add a layer of chilling suspense that defines the Gothic genre. Searching for a Wuthering Heights PDF often leads readers to discover the ghostly aspects of the tale. Is Catherine’s ghost real, or is it a figment of a tortured mind? The ambiguity is part of the book’s brilliance. With an electronic version, you can read late into the night, illuminated by the glow of your device, which adds to the spooky atmosphere. It is the perfect way to experience the haunting presence that permeates the narrative from beginning to end. https://wutheringheightspdf.site/ Wuthering Heights Chapter 2 Pdf
betterthanthemovieVat on said:
Lynn Painter’s writing style is addictive, making it hard to stop reading once you begin. The world of Liz and Wes is immersive and full of heart. A Better Than the Movies PDF is a convenient option for digital readers. It is a book that will make you look at your own neighbors differently, wondering if your soulmate is just a lawn away. https://betterthanthemoviespdf.site/ Better Than The Movies Epub
prideandprejudicepVat on said:
Students of literature often find themselves returning to the intricate dance of courtship presented in Austen’s work. It is a study of character, reputation, and the errors of judgment. If you are preparing for an essay or simply want to understand the cultural impact of the novel, having the text at your fingertips is vital. A search for a Pride and Prejudice PDF often leads readers to various editions, but our focus is on the purity of the story. We provide a space where the narrative takes center stage. enhance your reading list with a digital version that brings the balls and drawing rooms of the 19th century to your screen. https://prideandprejudicepdf.site/ Plot Summary Of Pride And Prejudice Pdf
eastofedenpdfVat on said:
The description of the Salinas lettuce business might sound boring, but Steinbeck makes it a high-stakes thriller of refrigeration and trains. It is about innovation. Business students can actually learn from Cal’s ventures. An East of Eden PDF makes finding these business plots easy. Our content analyzes Cal’s entrepreneurial spirit, discussing how it relates to his need for approval. We show how even the business details serve the emotional plot. https://eastofedenpdf.site/ East Of Eden Pdf Chapter 8
wutheringheightspdVat on said:
The narrative of Wuthering Heights is a puzzle that pieces together the history of two doomed families. A Wuthering Heights PDF is the best tool for solving this puzzle at your own pace. As Nelly Dean recounts the past to Mr. Lockwood, the reader is drawn deeper into a web of secrets. The electronic format is perfect for the modern reader who values accessibility and portability. You do not need to carry a heavy volume to enjoy this literary classic; you simply need a device and a desire to explore the darker side of human nature. https://wutheringheightspdf.site/ Kate Bush Wuthering Heights Pdf
betterthanthemovieVat on said:
The plot of this book is a masterclass in pacing and character development. You will watch Liz grow from a fantasy-obsessed teenager into a young woman who appreciates real connection. Finding a Better Than the Movies PDF is a simple step toward enjoying this transformative story. It is a narrative that stays with you long after the final page, reminding you that life doesn’t need a script to be beautiful. https://betterthanthemoviespdf.site/ Better Than The Movies Download Epub
prideandprejudicepVat on said:
The novel is a testament to the power of change. Both Elizabeth and Darcy have to change to be happy. This is a hopeful message. To feel this hope, read their story. A Pride and Prejudice PDF is a story of redemption. Our platform champions personal growth. Be inspired by the capacity for change in us all. https://prideandprejudicepdf.site/ Pride And Prejudice Script Pdf Free Download
eastofedenpdfVat on said:
While the movie adaptation with James Dean is famous, it only covers the latter part of the book. To truly understand the story, one must read the novel in its entirety. The backstory of Adam and Charles is essential. If you have seen the film and want the full story, downloading an East of Eden PDF is a great way to fill in the gaps. Our website compares the film to the book, highlighting the vast amount of material that was left out. We encourage movie fans to become readers, guiding them through the rich narrative that inspired the cinema classic. https://eastofedenpdf.site/ Download Pdf John Steinbeck East Of Eden
betterthanthemovieVat on said:
Unlock a world of romance and witty banter with Lynn Painter’s beloved novel. The story of Liz and Wes is a testament to the fact that first impressions are often wrong. Whether you are reading a physical copy or a Better Than the Movies PDF, the experience is equally magical. It is a book that encourages you to throw away the script and live in the moment, embracing the unexpected twists of life and love. https://betterthanthemoviespdf.site/ Better Than The Movies Pdf Online
wutheringheightspdVat on said:
If you are a fan of dark academia, this book is a quintessential read. A Wuthering Heights PDF fits perfectly into a digital library of classic, moody literature. The themes of death, the supernatural, and intense study (seen through the character of young Cathy) resonate with the aesthetic. The digital format allows you to read in low light, enhancing the gloomy, atmospheric vibe of the novel. It is a story that feels ancient and mythical, yet it is easily accessible through modern technology for anyone looking to add a touch of Gothic romance to their reading list. https://wutheringheightspdf.site/ Wuthering Heights Essay Pdf
prideandprejudicepVat on said:
The intricate dance of courtship in the Regency era is fascinating to behold. Every glance and gesture holds meaning. To decode these signals, the text is your guide. A Pride and Prejudice PDF offers a front-row seat to the social season. Our website is a resource for understanding these subtle interactions. Dive into a time when romance was a high-stakes game of strategy and heart. https://prideandprejudicepdf.site/ Original Pride And Prejudice Pdf
eastofedenpdfVat on said:
Steinbeck wrote this novel for his sons, wanting to describe the sights, sounds, and smells of their homeland. This personal touch is evident in every description of the wildflowers and the mountains. If you are planning a trip to literary California, having an East of Eden PDF on your tablet is a great way to experience the location through Steinbeck’s eyes while you travel. Our website offers a literary map of sorts, guiding you through the significant locations mentioned in the book. We help bring the digital text to life, connecting the fictional world with the real geography of the Salinas Valley. https://eastofedenpdf.site/ John Steinbeck East Of Eden Pdf
betterthanthemovieVat on said:
This novel is a masterclass in tension and release. The build-up to Liz and Wes getting together is exquisite. A PDF download is the quickest way to experience this gratification. It is a story that proves that patience is a virtue, especially when the reward is a love better than the movies. https://betterthanthemoviespdf.site/ Better Than The Movies.pdf
wutheringheightspdVat on said:
Why do readers continue to be obsessed with a novel published in 1847? The answer lies in the raw human emotion found on every page. Finding a Wuthering Heights PDF allows you to join the millions who have been moved by this story. It is not just a love story; it is a tragedy about the loss of the self. The famous quote, “I am Heathcliff,” resonates because it speaks to a connection deeper than romance. Reading this digitally brings these powerful words to life on your screen, offering a convenient entry point into a world of intense feeling. https://wutheringheightspdf.site/ Wuthering Heights Download Epub
prideandprejudicepVat on said:
The tension between pride and prejudice is not just the title of the book; it is the central conflict driving the plot. Elizabeth’s prejudice and Darcy’s pride must be overcome for happiness to be achieved. This narrative arc is perfect for analysis. Readers often seek a Pride and Prejudice PDF to easily highlight passages and take notes. Our website caters to this intellectual curiosity, focusing on the text that started it all. whether you are a first-time reader or a lifelong fan, having the book in a digital format ensures that the wisdom of Jane Austen is always within reach. https://prideandprejudicepdf.site/ Pride And Prejudice Online Free Pdf
Pdf East Of Eden on said:
The philosophical conversations between Adam Trask, Lee, and Samuel Hamilton are arguably some of the most important in 20th-century fiction. If you are preparing for a literature exam or a book club discussion, having access to the text is crucial for citing specific quotes. While holding a physical book has its charm, finding an East of Eden PDF or digital version can be incredibly useful for searching specific keywords and recurring motifs. We delve deep into the character of Cathy Ames and the concept of original sin, providing resources that complement your reading experience, regardless of the format you choose to explore this masterpiece.
Wuthering Heights As A Psychological Novel Pdf on said:
Emily Brontë’s vision of love is all-consuming. A Wuthering Heights PDF details a passion that transcends death. “I cannot live without my life! I cannot live without my soul!” These cries echo through the digital pages. The electronic format allows you to carry these intense declarations with you. It is a reminder of the power of human connection. The story of Heathcliff and Catherine is the ultimate testament to a love that refuses to die, and the digital book ensures their story lives on forever.
Analysis Of Wuthering Heights Pdf on said:
Teachers often recommend digital texts to help students engage with classic literature. A Wuthering Heights PDF can make the dense Victorian prose more approachable. Many digital readers offer built-in dictionaries, which are invaluable for understanding the dialect and vocabulary used by Brontë. This removes barriers to comprehension and allows the reader to focus on the plot and themes. Whether it is the depiction of the harsh Yorkshire winter or the fiery temperaments of the characters, the digital version makes the text accessible to a new generation of learners.
Better Than The Movies Epub Free Download on said:
Prepare for a serious book hangover after you finish this gem. The emotional investment you will have in Wes and Liz is significant. Many readers start by looking for a Better Than the Movies PDF to see what the hype is about and end up buying a physical copy too. It is a story that captures the intensity of teenage feelings without ever being condescending or cliché.
Wuthering Heights Penguin Readers Level 5 Pdf on said:
The enduring mystery of Heathcliff’s origins is one of the most intriguing aspects of the book. Where did he come from? To look for clues, you might want to scour a Wuthering Heights PDF. The text offers subtle hints but no definitive answers, leaving it up to the reader’s imagination. A digital copy allows you to closely examine the early chapters where Mr. Earnshaw brings the boy home. It is a puzzle that has baffled scholars for decades, and having the text in a searchable format lets you play detective in one of literature’s greatest mysteries.
East Of Eden Test Pdf on said:
For those who love audiobooks, having the text as a companion is often helpful to check spelling of names or re-read complex passages. The prose is dense and sometimes requires a second look. An East of Eden PDF is the perfect companion to an audio narration. Our website provides a glossary of names and places, ensuring you can follow along accurately. We support multi-modal reading, ensuring you get the full benefit of Steinbeck’s complex narrative.
Pride And Prejudice Full Story Pdf on said:
There is a comfort in returning to a favorite book, and for many, that book is Austen’s most famous work. The familiarity of the characters feels like visiting old friends. If your physical copy is worn out, a digital version is a great backup. Many fans keep a Pride and Prejudice PDF on their devices for emergency reading. Our site celebrates this fandom, offering a hub for the novel. whether you are reading it for the first time or the fiftieth, the story never loses its charm.
Better Than The Movies Free Epub on said:
From the soundtrack references to the classic rom-com setups, this book is a treat for pop culture fans. Liz Buxbaum is a heroine you will want to be best friends with, and Wes is the ultimate swoon-worthy lead. Getting your hands on a PDF version ensures you can devour this story during your commute or lunch break. It is a feel-good novel that leaves you with a smile on your face and a renewed belief in romance.
East Of Eden Pdf Free on said:
Steinbeck’s dedication to historical accuracy regarding the development of the Salinas Valley makes this book not just a novel, but a slice of history. From the mechanics of the early Ford cars to the agricultural shifts, the detail is astounding. History buffs often seek out the East of Eden PDF to easily access these specific passages without flipping through hundreds of pages. We provide context to these historical elements, explaining how the environment shapes the characters’ destinies. Our content is tailored to help you appreciate the setting as much as the plot, enhancing your reading of the digital text.
Wuthering Heights Questions And Answers Pdf on said:
If you are looking for a story that challenges traditional gender roles, this is it. A Wuthering Heights PDF reveals a heroine in Catherine who is wild, arrogant, and strong – traits often denied to Victorian women. She is not the typical damsel. Likewise, the men often show vulnerability and weakness. The digital text allows you to find and analyze the passages where these gender norms are subverted. It is a forward-thinking novel in many respects, and reading it digitally highlights the modern relevance of Brontë’s characterizations.
Better Than The Movies Pdf on said:
For a story that feels like a warm cup of cocoa on a cold day, choose this book. The comfort and joy it brings are unmatched in the YA contemporary genre. A Better Than the Movies PDF is a great addition to any digital library. It is a book that hugs your heart and reminds you that the best love stories are the ones that feel like home.
East Of Eden By John Steinbeck Pdf Download on said:
The intricate plotting of the novel ensures that no detail is wasted. Events in the first chapter resonate in the last. It is a tightly woven net of cause and effect. Mystery fans will appreciate the slow reveal of secrets. An East of Eden PDF allows for easy backtracking to check clues and foreshadowing. Our content highlights these narrative threads, showing how masterfully Steinbeck constructed the plot. We help you appreciate the architectural genius of the novel’s structure.
Pride And Prejudice Epub Download on said:
The wit of the novel is not just in the dialogue, but in the narration itself. The narrator’s voice is dry and observant. To hear this voice, you must read the prose. A Pride and Prejudice PDF brings the narrator to your screen. Our platform is dedicated to the tone of the book. We ensure that the humor of the narrator is not lost. Enjoy the commentary that accompanies the action.
Wuthering Heights Case Studies In Contemporary Criticism Pdf on said:
The enduring mystery of Heathcliff’s origins is one of the most intriguing aspects of the book. Where did he come from? To look for clues, you might want to scour a Wuthering Heights PDF. The text offers subtle hints but no definitive answers, leaving it up to the reader’s imagination. A digital copy allows you to closely examine the early chapters where Mr. Earnshaw brings the boy home. It is a puzzle that has baffled scholars for decades, and having the text in a searchable format lets you play detective in one of literature’s greatest mysteries.
Better Than The Movies Ocean Of Pdf on said:
The plot of this book is a masterclass in pacing and character development. You will watch Liz grow from a fantasy-obsessed teenager into a young woman who appreciates real connection. Finding a Better Than the Movies PDF is a simple step toward enjoying this transformative story. It is a narrative that stays with you long after the final page, reminding you that life doesn’t need a script to be beautiful.
East Of Eden Epub Download on said:
Steinbeck himself considered East of Eden to be his magnum opus, the work that all his previous novels had been practicing for. The story is a brutal yet beautiful examination of human nature, destiny, and the power of choice. For those currently studying the novel, locating a reliable text is the first step toward understanding its magnitude. Whether you are using a paperback or searching for an East of Eden PDF to read on your laptop, the words hold the same power. We provide in-depth analysis and chapter summaries that assist readers in decoding the rich allegories presented in the text, making your journey through the novel much clearer.
thesummeriturnedprVat on said:
The relationship between Belly and her mother is just as important as the romance. Jenny Han gives equal weight to family dynamics. If you are looking for the PDF, you will find a balanced story. “The Summer I Turned Pretty” is about the difficulty of growing up and pulling away from your parents. It is also about the enduring bond of family. It is a touching and well-rounded novel. https://thesummeriturnedprettypdf.site/ The Summer I Turned Pretty Book Epub Download
thesummeriturnedprVat on said:
The final days of summer are the hardest. Jenny Han captures the reluctance to leave. The PDF of the book is a way to stay a little longer. The Summer I Turned Pretty is about the inevitable end of the season. But the ending of the book is just the beginning of the story. It is a perfect setup for the rest of the series. https://thesummeriturnedprettypdf.site/ The Summer I Turned Pretty Free Pdf Download
thesummeriturnedprVat on said:
The summer house at Cousins is a place out of time. Jenny Han creates a sanctuary for her characters. The search for “The Summer I Turned Pretty PDF” often leads to this haven. The story is about the safety of the known and the thrill of the unknown. Belly is stepping out of her comfort zone. The results are messy and beautiful. It is a captivating story. https://thesummeriturnedprettypdf.site/ The Summer I Turned Pretty Notably Pdf
The Summer I Turned Pretty Book 2 Pdf Free Download on said:
If you love stories about love triangles and beach houses, this is the gold standard. Jenny Han has created iconic characters in Belly, Conrad, and Jeremiah. A quick search for the PDF can land you right in the middle of their drama. The Summer I Turned Pretty captures the feeling of being on the precipice of adulthood. The choices Belly makes this summer will define her future. It is a gripping narrative that you won’t want to put down.
Enriquegaign on said:
dental website development https://otvetnow.ru telematics tracking
tomsawyerpdfVat on said:
Mark Twain’s tale of a young boy’s life is a story that never loses its charm. The Adventures of Tom Sawyer is filled with excitement and laughter. We provide a digital text that is perfect for reading on tablets and smartphones. Our version is clean and easy to navigate. With a Tom Sawyer PDF, you can take the story with you wherever you go, making it easy to escape into the world of Mark Twain. https://tomsawyerpdf.store/ Las Aventuras De Tom Sawyer Resumen Por Capitulos Pdf
tombofannihilationVat on said:
Venture into the savage land of Chult, where the very concept of death is broken. This campaign is notorious for its difficulty and the rich, vibrant setting that Wizards of the Coast has created. For Dungeon Masters preparing to run this, having access to the Tomb of Annihilation PDF or digital equivalent is a game-changer for managing the hexcrawl mechanics. The adventure spans from the bustling Port Nyanzaru to the forbidden city of Omu. Without the right guide, your party will surely perish. The book details every trap, monster, and puzzle required to stop the Death Curse. Make sure you have all the lore and stat blocks ready before your players roll initiative. https://tombofannihilationpdf.store/ Tomb Of Annihilation Pdf Torrent Kickass
animalfarmpdfVat on said:
The corruption of language is a central theme in this novella. Words are redefined until they mean the opposite of their original intent. This “Newspeak,” a concept Orwell expanded on in 1984, has its roots here. Reading the text, perhaps as an Animal Farm PDF, allows you to trace the evolution of the Seven Commandments. It is a chilling demonstration of how controlling language allows the state to control reality itself. This book is a toolkit for intellectual self-defense. https://animalfarmpdf.store/ Animal Farm A Fairy Story George Orwell Pdf
tomsawyerpdfVat on said:
Relive the adventures of Tom and Huck with a digital copy of Mark Twain’s masterpiece. The Adventures of Tom Sawyer is a book that captures the spirit of youth. Our website offers the full text in a format that is compatible with all e-readers. If you want to read the book on your commute or in bed, our digital edition is perfect. A Tom Sawyer PDF ensures that you have instant access to this classic story whenever you want. https://tomsawyerpdf.store/ Las Aventuras De Tom Sawyer Pdf Descargar
tombofannihilationVat on said:
For new Dungeon Masters, this module can be intimidating. However, the structure is logical. It starts with a city, moves to the wilderness, then a ruined city, and finally a dungeon. Reading the Tomb of Annihilation PDF from start to finish before running it is highly recommended. The digital format allows for highlighting and note-taking. You can annotate your PDF with reminders about which foreshadowing clues to drop in the early chapters. This preparation is key to weaving a cohesive story where the payoff in the final tomb feels earned and significant for the players. https://tombofannihilationpdf.store/ Tomb Of Annihilation Charter Of Exploitation Pdf
theawakeningpdfVat on said:
The sea is a character in its own right in this novel, offering both freedom and destruction. “The touch of the sea is sensuous, enfolding the body in its soft, close embrace.” To read these beautiful descriptions, look for the awakening pdf. The liquidity of the prose matches the subject matter perfectly. A digital version is ideal for readers who want to highlight these lyrical passages for later inspiration. It is a novel that washes over you, leaving a lasting impression of the power of nature and the human spirit. https://theawakeningpdf.store/ The Awakening Pdf Book
Tomb Of Annihilation Pdf 5E Free on said:
The “Atropal” is a concept that disturbs many players – an unfinished god. It is the battery for the Soulmonger. The description in the Tomb of Annihilation PDF is graphic and horrifying. DMs use the digital text to describe its wailing and its necrotic aura. The mechanics of fighting a floating, god-tier fetus are complex. The PDF clarifies its link to the Soulmonger struts and the lava pit below. Having these rules clear ensures the climax of the campaign feels mechanically sound and thematically appropriate for such a dark adventure.
The Animal Farm Pdf Free Download on said:
The role of the dogs as the enforcement arm of the state is terrifying. They represent the military and police forces used to suppress dissent. Napoleon raises them in isolation to be loyal only to him. Analyzing this aspect of the text via an Animal Farm PDF sheds light on how dictators maintain power through force. Orwell shows that without the threat of violence, many totalitarian regimes would crumble.
The Awakening Kate Chopin Chapter 1 Pdf on said:
Reading classics can sometimes feel like a chore, but not with this book. The prose is fresh, modern, and accessible. If you want to expand your literary horizons, finding the awakening pdf is a great place to start. It is widely available and easy to read on any device. The story pulls you in from the first page and doesn’t let go until the tragic end. It is a perfect entry point for anyone looking to get into classic American fiction.
xanatharsguidetoevVat on said:
Navigating the complex rules of 5th Edition becomes much easier with the clarifications provided in this volume. Xanathar’s Guide to Everything revisits core concepts like falling, sleeping in armor, and tool proficiencies, giving them much-needed depth. If you have been searching for a Xanathar’s Guide to Everything PDF to settle table disputes, our articles outline the official rulings found in the book. We clarify the confusing aspects of the game so you can focus on the story rather than arguing over mechanics. Make your game run smoother with these essential rule updates and clarifications. https://xanatharsguidetoeverythingpdf.ru/ Xanathar’s Guide To Everything Pdf 5E 1D4
onyxstormepubVat on said:
The threat from beyond the wards is an existential crisis for the kingdom. The characters must unite or perish. The Onyx Storm epub chronicles their desperate fight for survival. The writing is sharp and engaging. The ebook version is a modern way to enjoy a classic tale of good versus evil. It is a book that you won’t be able to put down. https://onyxstormepub.ru/ Onyx Storm.pdf
thehungergamespdfVat on said:
The training center scores determine the odds for the tributes. It is here that Katniss reveals her archery skills to the Gamemakers. The tension between hiding one’s talent and showing off for sponsors is a key strategic element. This part of the book is fascinating for those interested in game theory and strategy. You can read about these strategies in detail by obtaining the book. A PDF version is often compatible with almost any digital device, making it easy to access. https://thehungergamespdf.ru/ The Hunger Games Full Text Pdf
kingofwrathpdfVat on said:
There is something incredibly satisfying about watching a powerful man fall to his knees for the woman he swore he wouldn’t love. Dante Russo is that man, and Vivian Lau is the woman who brings him down. The story is a masterclass in slow-burn tension that eventually ignites. If you are curious about the hype and looking for the King of Wrath PDF, you are in for a treat. The writing is sharp, the pacing is perfect, and the emotional payoff is huge. Prepare to add Dante to your list of top book boyfriends. https://kingofwrathpdf.ru/ King Of Wrath Ana Huang Pdf Free
onyxstormepubVat on said:
Violet Sorrengail is a hero for the ages. Her bravery and intelligence are inspiring. The Onyx Storm epub showcases her best moments. The political intrigue adds a layer of depth to the story. The ebook version is easy to download and read. It is a book that you will recommend to everyone you know. https://onyxstormepub.ru/ Onyx Storm Chapter 3 Pdf
kingofwrathpdfVat on said:
Vivian Lau’s journey of self-empowerment is just as compelling as the romance. She learns to stand up to her family and to Dante, finding her own voice in the process. Dante’s realization that she is his equal is a highlight of the book. For those interested in the King of Wrath PDF, the text offers a dual perspective that enriches the narrative. You get to see inside both their heads, understanding their motivations and fears. It creates a well-rounded and deeply satisfying story structure. https://kingofwrathpdf.ru/ King Of Wrath Epub Vk Ana Huang
thehungergamespdfVat on said:
The lavish food in the Capitol makes Katniss sick, both physically and morally. She compares every meal to how many days it would feed her family. This constant comparison highlights the disparity of wealth. It is a powerful narrative device. To see the world through Katniss’s eyes, grab the book. A The Hunger Games pdf is a great way to digest these heavy themes while enjoying a thrilling story of survival. https://thehungergamespdf.ru/ The Hunger Games Mockingjay Pdf Download
Onyx Storm Download Epub on said:
The stakes have shifted from surviving graduation to surviving extinction. The venin are a relentless enemy that requires new strategies to defeat. The Onyx Storm epub is your guide to this new era of warfare. Violet’s intelligence is her greatest weapon, and she uses it brilliantly. The digital edition is crisp and clear, perfect for long reading sessions. It is a story that stays with you long after you turn the device off.
Approaching The Hunger Games Trilogy Pdf on said:
The gamemakers control the weather, the time of day, and the hazards in the arena. It emphasizes that the tributes have no control over their environment. This lack of agency is a central theme. The book explores the feeling of being watched constantly. To dive into this dystopian nightmare, you need the novel. Digital reading is very popular for this genre, and finding a PDF or epub allows you to start reading instantly.
Xanathar's Guide To Everything Pdf The Eye on said:
The Cavalier Fighter brings the classic mounted knight archetype to 5th Edition with robust mechanics. Xanathar’s Guide to Everything ensures that even without a mount, these fighters are unmatched at protecting their allies. If you need a PDF overview of the “Mark” mechanic, our tanking guides explain it perfectly. We demonstrate how to lock down enemies and prevent them from harming your squishy wizard friends. Become the ultimate bulwark on the battlefield and defend your party with the Cavalier’s specialized technique.
Onyx Storm Free Read Online Pdf on said:
The magic system is one of the most innovative in recent years. The signets are cool and creative. The Onyx Storm epub explores the limits of this magic. The relationships are the heart of the book. The digital edition is perfect for the tech-savvy reader. It is a fantasy novel that delivers the goods.
The Hunger Games Online Book Free Pdf on said:
From the first sentence to the last, The Hunger Games is a gripping exploration of human nature. It asks what you would do to survive. It asks how much of yourself you would give up to save someone you love. These are big questions. Explore them by reading the book. A downloadable The Hunger Games pdf makes it easy to carry these heavy questions with you, offering a thought-provoking escape into a world that feels frighteningly close to our own.
DonaldWet on said:
https://marketsdarkweb.com nexus dark
DonaldWet on said:
silk road market url https://marketsdarkweb.com/
Zerrjousy on said:
darknet markets 2026 https://hydra-marketru.com/
Freddywic on said:
nexus site official link https://hydra-marketplace.com/
DennyAxody on said:
ares link https://monopoly-market-onion.com/
KixxNab on said:
silk road market url https://torrez-market-linkss.com/
DonaldWet on said:
nexus darknet market alternatives https://marketsdarkweb.com/
Freddywic on said:
black ops market https://hydra-marketplace.com/
KixxNab on said:
cannaexpress darknet link https://torrez-market-linkss.com/
Zerrjousy on said:
darknet markets 2026 https://tordarknetmarket.com/
DennyAxody on said:
drughub market link https://darknetmarketoffers.com/
Hannah Rodriguez on said:
Your blog is a ray of sunshine in a sometimes dark and dreary world Thank you for spreading positivity and light
John Smith on said:
Your blog has quickly become one of my favorites I am constantly impressed by the quality and depth of your content
Pooja Kumar on said:
I completely agree with your perspective on this topic It’s refreshing to see someone presenting a balanced and thoughtful viewpoint
开设Binance账户 on said:
I don’t think the title of your article matches the content lol. Just kidding, mainly because I had some doubts after reading the article.
Sign Up on said:
Can you be more specific about the content of your article? After reading it, I still have some doubts. Hope you can help me.
Oliver Smith on said:
Taking orders while I sleep has completely changed my business revenue. Highly recommend this for any shop owner! https://webilaa.com/
Oliver Smith on said:
This blog is such a hidden gem I stumbled upon it by chance and now I’m completely hooked!
MatthewTug on said:
ufc fight night: ufc 330 start time – ufc 330 fight card
EdwinPlate on said:
https://sepharmtop.online/# dansk apotek
RaymondFaf on said:
Svenska Pharma: procent till mg/ml – apotek finland leverans sverige
LarrygaigE on said:
https://pharmrate.monster/# mexican pharmacy near me
Orvillemeert on said:
cs2 iem cologne https://iem-cologne.xyz/ iem cologne major
JosephVop on said:
is mexipharmacy legit medication from mexico mail order pharmacy mexico
EdwinPlate on said:
https://pharmrate.monster/# mexico pharmacy price list
LarrygaigE on said:
https://swtop.online/# Svenska Pharma
RaymondFaf on said:
melatonin 10 mg apotek: Svenska Pharma – Svenska Pharma
EdwinPlate on said:
https://sansordonnancefrance.sbs/# Viagra vente libre pays
RaymondFaf on said:
Viagra femme ou trouver: Acheter Sildenafil 100mg sans ordonnance – Viagra sans ordonnance livraison 24h
Orvillemeert on said:
iem major cologne 2026 https://iem-cologne.xyz/ cologne major
LarrygaigE on said:
https://pharmmex.sbs/# mexican pharmacies online drugs
JosephVop on said:
Svenska Pharma ibuprofen apotek häst löss
EdwinPlate on said:
https://sepharmtop.online/# Svenska Pharma
EdwinPlate on said:
https://swtop.online/# Svenska Pharma
LarrygaigE on said:
https://pharmmex.today/# online pharmacies in mexico
LarrygaigE on said:
https://pharmmex.sbs/# mexico pet pharmacy
JosephVop on said:
hydrocodone mexico pharmacy mexipharmacy reviews online mexican pharmacies
EdwinPlate on said:
https://swtop.online/# Svenska Pharma
EdwinPlate on said:
https://sansordonnancefrance.sbs/# Viagra prix pharmacie paris
LarrygaigE on said:
https://pharmmex.today/# mexican pharmacy ship to usa
JosephVop on said:
vitlök katt Svenska Pharma beställa medicin på apoteket
EdwinPlate on said:
https://pharmrate.monster/# mexico online farmacia
LarrygaigE on said:
https://pharmmex.sbs/# affordable pharmacy
EdwinPlate on said:
https://swtop.online/# Svenska Pharma
LarrygaigE on said:
https://pharmmex.sbs/# mexico prescription online
EdwinPlate on said:
https://sansordonnancefrance.sbs/# Viagra sans ordonnance 24h Amazon
JosephVop on said:
Svenska Pharma Svenska Pharma kylväska medicin apotek
LarrygaigE on said:
https://pharmmex.today/# mexican pharmacies that ship
EdwinPlate on said:
https://pharmrate.monster/# mexipharmacy reviews
LarrygaigE on said:
https://sansordonnancefrance.sbs/# Prix du Viagra 100mg en France
JosephVop on said:
prescriptions from mexico pharmacies in mexico that ship to the us mexico pet pharmacy
EdwinPlate on said:
https://sansordonnancefrance.sbs/# SildГ©nafil 100mg pharmacie en ligne
LarrygaigE on said:
https://sansordonnancefrance.sbs/# Viagra pas cher livraison rapide france
EdwinPlate on said:
https://pharmmex.sbs/# can i buy meds from mexico online
LarrygaigE on said:
https://swtop.online/# hur stavas yoghurt
LarrygaigE on said:
https://pharmrate.monster/# mexican pharmacy prices
EdwinPlate on said:
https://sansordonnancefrance.sbs/# Viagra sans ordonnance livraison 24h
JosephVop on said:
Viagra sans ordonnance livraison 48h Viagra pas cher livraison rapide france Sildenafil teva 100 mg sans ordonnance
Orvillemeert on said:
iem cologne major https://iem-cologne.xyz/ iem cologne major
LarrygaigE on said:
https://swtop.online/# Svenska Pharma
EdwinPlate on said:
https://swtop.online/# Svenska Pharma
LarrygaigE on said:
https://pharmrate.monster/# mexico pharmacy order online
Orvillemeert on said:
cs2 iem cologne 2026 https://iem-cologne.xyz/ cologne major
JosephVop on said:
pharmacy in mexico pharmacia mexico medication from mexico
LarrygaigE on said:
https://pharmrate.monster/# best pharmacy in mexico
HowardFuS on said:
https://northbridgepharm.com/# canada online pharmacy
TravisTew on said:
mexican pharmacy: mexico pharmacy – mexican online pharmacy
Cliftonpause on said:
mexico pharmacy: mexico pharmacy – mexican online pharmacy
Charlesscoum on said:
https://healthspherepharmacy.shop/# top 10 pharmacies in india
HowardFuS on said:
https://northbridgepharm.shop/# canadian pharmacy online
TravisTew on said:
india pharmacy mail order: online indian pharmacy – pharmacy websites
Cliftonpause on said:
NorthBridge Pharmacy: NorthBridge Pharmacy – NorthBridge Pharmacy
HowardFuS on said:
https://casasaludpharmacy.shop/# CasaSalud Pharmacy
TravisTew on said:
best india pharmacy: online indian pharmacy – trustworthy online pharmacy
Charlesscoum on said:
http://healthspherepharmacy.com/# Online medicine order
MarvinWon on said:
mexican online pharmacy CasaSalud Pharmacy mexican pharmacy online
TravisTew on said:
CasaSalud Pharmacy: mexican pharmacy – CasaSalud Pharmacy
Cliftonpause on said:
mexican pharmacy: CasaSalud Pharmacy – CasaSalud Pharmacy
HowardFuS on said:
https://healthspherepharmacy.shop/# best india pharmacy
TravisTew on said:
mail order pharmacy india: HealthSphere Pharmacy – trusted online pharmacy
HowardFuS on said:
https://healthspherepharmacy.com/# top 10 online pharmacy in india
Cliftonpause on said:
india pharmacy: online indian pharmacy – no prescription pharmacy paypal
MarvinWon on said:
mexican pharmacy mexico pharmacy online mexican pharmacy
Charlesscoum on said:
https://northbridgepharm.com/# online canadian pharmacy
TravisTew on said:
reputable indian pharmacies: india pharmacy – online drugs order
Cliftonpause on said:
canadian pharmacy: online canadian pharmacy – canadian prescription pharmacy
HowardFuS on said:
http://northbridgepharm.com/# canada pharmacy
TravisTew on said:
best india pharmacy: indian pharmacy online – safe online pharmacies
HowardFuS on said:
http://healthspherepharmacy.com/# best india pharmacy
Cliftonpause on said:
mexican online pharmacy: mexican pharmacy online – mexican pharmacy online
Charlesscoum on said:
https://northbridgepharm.com/# online canadian pharmacy
TravisTew on said:
mexico pharmacy: mexico pharmacy – CasaSalud Pharmacy
MarvinWon on said:
canadian pharmacy online NorthBridge Pharmacy canadian online pharmacy
TravisTew on said:
mexican pharmacy: online mexican pharmacy – mexican pharmacy
Cliftonpause on said:
NorthBridge Pharmacy: canada online pharmacy – pharmacy in canada
HowardFuS on said:
https://northbridgepharm.com/# online canadian pharmacy
HowardFuS on said:
https://healthspherepharmacy.com/# indian pharmacy
TravisTew on said:
reputable indian online pharmacy: indian pharmacy online – top-rated online pharmacies
Charlesscoum on said:
https://northbridgepharm.com/# canada pharmacy online
MarvinWon on said:
india online pharmacy online indian pharmacy online drugs order
TravisTew on said:
online canadian pharmacy: canada pharmacy online – canadian pharmacy
HowardFuS on said:
http://healthspherepharmacy.com/# mail order pharmacy india
Cliftonpause on said:
online mexican pharmacy: mexico pharmacy – mexican online pharmacy
TravisTew on said:
mexican pharmacy: mexico pharmacy – online mexican pharmacy
Charlesscoum on said:
https://healthspherepharmacy.shop/# reputable indian online pharmacy
HowardFuS on said:
http://northbridgepharm.com/# best canadian pharmacy
TravisTew on said:
canadian prescription pharmacy: canadian pharmacy – online canadian pharmacy
Cliftonpause on said:
best canadian pharmacy: canadian prescription pharmacy – canadian prescription pharmacy
MarvinWon on said:
CasaSalud Pharmacy mexican pharmacy online mexican online pharmacy
TravisTew on said:
indian pharmacy paypal: indian pharmacy online – worldwide pharmacy
HowardFuS on said:
https://healthspherepharmacy.shop/# cheapest online pharmacy india
Charlesscoum on said:
https://northbridgepharm.shop/# canadian prescription pharmacy
HowardFuS on said:
http://casasaludpharmacy.com/# online mexican pharmacy
TravisTew on said:
pharmacy in canada: canada pharmacy – canada pharmacy
Cliftonpause on said:
mexican pharmacy online: mexican pharmacy online – mexican online pharmacy
MarvinWon on said:
mexico pharmacy mexican pharmacy online mexican pharmacy online
TravisTew on said:
mexico pharmacy: CasaSalud Pharmacy – mexican online pharmacy
HowardFuS on said:
http://northbridgepharm.com/# canada pharmacy online
Charlesscoum on said:
http://healthspherepharmacy.com/# online pharmacy india
Cliftonpause on said:
canada pharmacy: NorthBridge Pharmacy – canadian prescription pharmacy
TravisTew on said:
canadian prescription pharmacy: pharmacy in canada – canadian pharmacy
HowardFuS on said:
http://casasaludpharmacy.com/# online mexican pharmacy
TravisTew on said:
top 10 pharmacies in india: indian online pharmacy – best mail order pharmacy
MarvinWon on said:
canada pharmacy canadian online pharmacy canadian pharmacy online
TravisTew on said:
canadian pharmacy: best canadian pharmacy – best canadian pharmacy
HowardFuS on said:
https://casasaludpharmacy.shop/# mexico pharmacy
Cliftonpause on said:
CasaSalud Pharmacy: mexican pharmacy online – mexican pharmacy
Charlesscoum on said:
http://northbridgepharm.com/# canada pharmacy
HowardFuS on said:
http://healthspherepharmacy.com/# indian pharmacy paypal
TravisTew on said:
canada online pharmacy: canada pharmacy – canadian online pharmacy
MarvinWon on said:
canadian prescription pharmacy NorthBridge Pharmacy canada pharmacy
TravisTew on said:
Online medicine order: india pharmacy – top online pharmacy
Cliftonpause on said:
mexican online pharmacy: CasaSalud Pharmacy – mexican pharmacy
HowardFuS on said:
http://northbridgepharm.com/# canada pharmacy online
Charlesscoum on said:
https://healthspherepharmacy.com/# online pharmacy india
TravisTew on said:
mexican pharmacy: mexican pharmacy online – mexico pharmacy
HowardFuS on said:
http://healthspherepharmacy.com/# top online pharmacy india
TravisTew on said:
CasaSalud Pharmacy: mexican online pharmacy – mexican online pharmacy
MarvinWon on said:
canadian online pharmacy canadian pharmacy online pharmacy in canada
Cliftonpause on said:
pharmacy in canada: canada pharmacy online – NorthBridge Pharmacy
HowardFuS on said:
https://casasaludpharmacy.com/# CasaSalud Pharmacy
TravisTew on said:
reputable indian online pharmacy: HealthSphere Pharmacy – trustworthy online pharmacy
Charlesscoum on said:
https://casasaludpharmacy.com/# CasaSalud Pharmacy
HowardFuS on said:
https://northbridgepharm.com/# canadian prescription pharmacy
TravisTew on said:
canadian pharmacy online: NorthBridge Pharmacy – canadian prescription pharmacy
MarvinWon on said:
mexican pharmacy online online mexican pharmacy CasaSalud Pharmacy
Cliftonpause on said:
mexico pharmacy: mexican pharmacy online – online mexican pharmacy
TravisTew on said:
mexican online pharmacy: online mexican pharmacy – mexican online pharmacy
HowardFuS on said:
https://healthspherepharmacy.shop/# india pharmacy
Charlesscoum on said:
https://healthspherepharmacy.com/# indian pharmacy paypal
HowardFuS on said:
https://casasaludpharmacy.com/# mexican online pharmacy
TravisTew on said:
canadian prescription pharmacy: canadian pharmacy – canada pharmacy
Cliftonpause on said:
online canadian pharmacy: canada pharmacy online – pharmacy in canada
TravisTew on said:
mexican pharmacy online: online mexican pharmacy – CasaSalud Pharmacy
MarvinWon on said:
indian pharmacy paypal indian online pharmacy secure medical online pharmacy
HowardFuS on said:
https://northbridgepharm.shop/# canada online pharmacy
TravisTew on said:
buy prescription drugs from india: indian pharmacy online – online drugs order
HowardFuS on said:
https://healthspherepharmacy.shop/# cheapest online pharmacy india
Cliftonpause on said:
mexican online pharmacy: mexican pharmacy – CasaSalud Pharmacy
Charlesscoum on said:
http://northbridgepharm.com/# canadian pharmacy
TravisTew on said:
top 10 online pharmacy in india: online indian pharmacy – medicine online order
MarvinWon on said:
online canadian pharmacy canadian prescription pharmacy canada pharmacy
TravisTew on said:
indian pharmacy paypal: indian online pharmacy – no prescription pharmacy paypal
HowardFuS on said:
https://northbridgepharm.shop/# canada online pharmacy
HowardFuS on said:
http://casasaludpharmacy.com/# mexico pharmacy
Cliftonpause on said:
mexico pharmacy: CasaSalud Pharmacy – online mexican pharmacy
Charlesscoum on said:
http://casasaludpharmacy.com/# mexican online pharmacy
TravisTew on said:
mexican pharmacy: CasaSalud Pharmacy – CasaSalud Pharmacy
TravisTew on said:
п»їlegitimate online pharmacies india: indian pharmacy online – best mail order pharmacy
MarvinWon on said:
canada pharmacy canadian pharmacy online online canadian pharmacy
HowardFuS on said:
https://casasaludpharmacy.shop/# mexican pharmacy online
Cliftonpause on said:
best canadian pharmacy: canada pharmacy – canada pharmacy online
TravisTew on said:
pharmacy in canada: pharmacy in canada – online canadian pharmacy
HowardFuS on said:
https://healthspherepharmacy.shop/# indian pharmacy online
Charlesscoum on said:
https://northbridgepharm.shop/# canadian pharmacy
TravisTew on said:
canadian pharmacy online: canada pharmacy online – canada pharmacy
MarvinWon on said:
top online pharmacy india india pharmacy no script pharmacy
DanielOvate on said:
https://mexicopharmrate.click/# mexico medication
Davidgeolf on said:
buying prescriptions in mexico: mexico rx – mexico pharmacy list
NestorOrinc on said:
progreso mexico pharmacy online: mexican pharmacy las vegas – mexico drug store online
DanielOvate on said:
https://svenskapharm.click/# Г¶ppet apotek
Davidgeolf on said:
Viagra 100mg prix: Viagra gГ©nГ©rique sans ordonnance en pharmacie – Viagra homme prix en pharmacie
Williammon on said:
https://mexicopharmrate.click/# prescriptions from mexico
NestorOrinc on said:
Svenska Pharma: apotek graviditetstest – fullmakt apotek
Davidgeolf on said:
Svenska Pharma: Svenska Pharma – bestГ¤lla medicin online
RobertExobE on said:
Viagra femme sans ordonnance 24h Acheter viagra en ligne livraison 24h Viagra femme ou trouver
DanielOvate on said:
https://mexicopharmrate.click/# prescriptions from mexico
NestorOrinc on said:
Viagra homme prix en pharmacie: Viagra homme sans prescription – Viagra pas cher livraison rapide france
DanielOvate on said:
https://pharmaciefr.click/# Prix du Viagra en pharmacie en France
Davidgeolf on said:
best mexican pharmacy: farmacias online usa – mexico pharmacy order online
NestorOrinc on said:
farmacia mexicana online: mexico prescriptions – mexican pharmacy that ships to the us
Williammon on said:
https://svenskapharm.click/# Svenska Pharma
RobertExobE on said:
apotek produkter Svenska Pharma svamp i underlivet apotek
Davidgeolf on said:
Viagra gГ©nГ©rique sans ordonnance en pharmacie: Viagra prix pharmacie paris – Viagra sans ordonnance livraison 48h
DanielOvate on said:
https://pharmaciefr.click/# Viagra 100 mg sans ordonnance
NestorOrinc on said:
Viagra femme sans ordonnance 24h: Viagra sans ordonnance 24h suisse – Viagra homme prix en pharmacie sans ordonnance
Davidgeolf on said:
handsprit engelska: Svenska Pharma – Svenska Pharma
DanielOvate on said:
https://svenskapharm.click/# apotek med snabbast leverans
NestorOrinc on said:
Viagra prix pharmacie paris: SildГ©nafil 100mg pharmacie en ligne – Prix du Viagra en pharmacie en France
Williammon on said:
https://pharmaciefr.click/# Viagra sans ordonnance pharmacie France
Davidgeolf on said:
farmacia pharmacy mexico purchase online: farmacia pharmacy mexico – mexican farmacia
RobertExobE on said:
apotek fri frakt Svenska Pharma rabattkod apotek
NestorOrinc on said:
los algodones pharmacy online: mexican online pharmacy – mexican pharmacies online drugs
DanielOvate on said:
https://mexicopharmrate.click/# medicine mexico
Davidgeolf on said:
Viagra en france livraison rapide: Viagra femme ou trouver – Viagra en france livraison rapide
DanielOvate on said:
https://svenskapharm.click/# handla billigt på nätet
NestorOrinc on said:
best online mexican pharmacy: phentermine in mexico pharmacy – order from mexico
Davidgeolf on said:
order from mexico: affordable pharmacy – medicine from mexico
Williammon on said:
https://svenskapharm.click/# olika apotek på nätet
RobertExobE on said:
apotek beställa hem apotek kundtjänst Svenska Pharma
Davidgeolf on said:
pharmacy in mexico city: mexican pharmacy online – mexican pharmacies that ship
NestorOrinc on said:
kГ¶pa glasГ¶gon pГҐ nГ¤tet: Svenska Pharma – apotek online
DanielOvate on said:
https://svenskapharm.click/# Svenska Pharma
DanielOvate on said:
https://mexicopharmrate.click/# best mexican pharmacy online
Davidgeolf on said:
Viagra en france livraison rapide: Viagra sans ordonnance livraison 48h – Prix du Viagra en pharmacie en France
NestorOrinc on said:
SildГ©nafil 100 mg prix en pharmacie en France: Viagra gГ©nГ©rique pas cher livraison rapide – Viagra pas cher livraison rapide france
Williammon on said:
https://pharmaciefr.click/# Viagra homme sans ordonnance belgique
Davidgeolf on said:
Sildenafil teva 100 mg sans ordonnance: Viagra homme prix en pharmacie – Le gГ©nГ©rique de Viagra
RobertExobE on said:
Acheter Sildenafil 100mg sans ordonnance Viagra sans ordonnance livraison 24h Acheter viagra en ligne livraison 24h
NestorOrinc on said:
bh rГ¶d: apotek assistent – destillerat vatten apotek
DanielOvate on said:
https://svenskapharm.click/# Svenska Pharma
Davidgeolf on said:
kГ¶p glasГ¶gon online: Svenska Pharma – apotek hemleverans
DanielOvate on said:
https://mexicoexpharm.click/# medicine mexico
NestorOrinc on said:
svamp app android gratis: Svenska Pharma – svamp app gratis
Williammon on said:
https://pharmaciefr.click/# SildГ©nafil 100mg pharmacie en ligne
Davidgeolf on said:
Viagra sans ordonnance 24h suisse: Prix du Viagra en pharmacie en France – Viagra sans ordonnance livraison 48h
Davidgeolf on said:
Svenska Pharma: fГ¶rkylning engelska – Svenska Pharma
DanielOvate on said:
https://mexicopharmrate.click/# prescriptions from mexico
Davidgeolf on said:
salttabletter apotek: bonding tГ¤nder pris – Svenska Pharma
DanielOvate on said:
https://svenskapharm.click/# Svenska Pharma
Williammon on said:
https://pharmaciefr.click/# Acheter viagra en ligne livraison 24h
Davidgeolf on said:
SildГ©nafil Teva 100 mg acheter: Meilleur Viagra sans ordonnance 24h – Viagra sans ordonnance livraison 24h
DanielOvate on said:
https://pharmaciefr.click/# SildГ©nafil 100 mg sans ordonnance
Davidgeolf on said:
online pharmacy in mexico: can i order online from a mexican pharmacy – my mexican pharmacy
DanielOvate on said:
https://pharmaciefr.click/# Viagra sans ordonnance livraison 48h
Davidgeolf on said:
mexican pharmacies that ship to the united states: mexico online farmacia – is mexipharmacy legit
NestorOrinc on said:
mexi pharmacy: can i order online from a mexican pharmacy – mexican drug store
Williammon on said:
https://mexicopharmrate.click/# online mexican pharmacy
Davidgeolf on said:
pharmacy mexico: pharmacies in mexico that ship to the us – buy drugs online
DanielOvate on said:
https://pharmaciefr.click/# Viagra homme prix en pharmacie sans ordonnance
Davidgeolf on said:
mexico drug store online: mexican pharmacies that ship – mexican pharmacy prices
DanielOvate on said:
https://mexicoexpharm.click/# buy drugs online
Davidgeolf on said:
skin tag remover apotek: apotek s – kroniska sjukdomar lista
Davidviere on said:
https://pregabalin.life/# pregabalin life
MatthewSausy on said:
https://cenforce.cheap/# buy cheap cenforce
Williamsef on said:
lyrica pregabalin: pregabalin life – pregabalin life
DonaldTic on said:
lyrica price buy generic lyrica pregabalin life
Richarddiree on said:
https://pregabalin.life/# lyrica pregabalin
Richarddiree on said:
https://cenforce.cheap/# buy cheap cenforce
MatthewSausy on said:
https://modafinil.pro/# where to buy Modafinil legally in the US
DonaldTic on said:
smart drugs online US pharmacy Modafinil for ADHD and narcolepsy Modafinil for focus and productivity
MatthewSausy on said:
https://cymbalta.top/# cymbalta medication
Williamsef on said:
pregabalin life: pregabalin life – cheap pregabalin
Richarddiree on said:
https://cymbalta.top/# cymbalta duloxetine
Davidviere on said:
https://cymbalta.top/# generic cymbalta
DonaldTic on said:
pregabalin life lyrica medication lyrica generic
Richarddiree on said:
https://pregabalin.life/# lyrica online
MatthewSausy on said:
https://cenforce.cheap/# cenforce
Williamsef on said:
cheap pregabalin: lyrica online – lyrica price
DonaldTic on said:
buy cheap cenforce cenforce price cenforce 200
Richarddiree on said:
https://modafinil.pro/# safe Provigil online delivery service
MatthewSausy on said:
https://pregabalin.life/# lyrica pregabalin
Davidviere on said:
https://cenforce.cheap/# cenforce tablet
DonaldTic on said:
buy generic lyrica buy lyrica lyrica medication
Richarddiree on said:
https://cenforce.cheap/# buy cheap cenforce
MatthewSausy on said:
https://cenforce.cheap/# buy cheap cenforce
Richarddiree on said:
https://cenforce.cheap/# cenforce cheap
Williamsef on said:
cymbalta: duloxetine – duloxetine
DonaldTic on said:
duloxetine buy cymbalta online cymbalta medication
MatthewSausy on said:
https://cenforce.cheap/# cenforce 200
Richarddiree on said:
https://modafinil.pro/# Modafinil Pro
Davidviere on said:
https://pregabalin.life/# lyrica price
DonaldTic on said:
Modafinil for ADHD and narcolepsy smart drugs online US pharmacy Modafinil for ADHD and narcolepsy
MatthewSausy on said:
https://cenforce.cheap/# cenforce
Williamsef on said:
cenforce tablet: buy cheap cenforce – cenforce
MatthewSausy on said:
https://cymbalta.top/# cymbalta
DonaldTic on said:
lyrica pregabalin lyrica online lyrica price
Davidviere on said:
https://cenforce.cheap/# cenforce tablet
Richarddiree on said:
https://pregabalin.life/# lyrica generic
DonaldTic on said:
Modafinil Pro Modafinil for focus and productivity nootropic Modafinil shipped to USA
Richarddiree on said:
https://pregabalin.life/# lyrica pregabalin
MatthewSausy on said:
https://modafinil.pro/# Modafinil for focus and productivity
Williamsef on said:
duloxetine: cymbalta for pain – buy cymbalta online
Richarddiree on said:
https://cymbalta.top/# cymbalta medication
MatthewSausy on said:
https://pregabalin.life/# cheap pregabalin
DonaldTic on said:
cenforce cenforce tablet buy cheap cenforce
Davidviere on said:
https://cenforce.cheap/# cenforce price
Richarddiree on said:
https://modafinil.pro/# order Provigil without prescription
DonaldTic on said:
duloxetine cymbalta for pain cymbalta medication
MatthewSausy on said:
https://modafinil.pro/# wakefulness medication online no Rx
Richarddiree on said:
https://cymbalta.top/# cymbalta medication
Williamsef on said:
buy generic lyrica: cheap pregabalin – lyrica pregabalin
MatthewSausy on said:
https://cenforce.cheap/# buy cheap cenforce
DonaldTic on said:
cenforce price cenforce cheap cenforce cheap
Davidviere on said:
https://pregabalin.life/# lyrica pregabalin
Richarddiree on said:
https://cymbalta.top/# cymbalta medication
DonaldTic on said:
cenforce price cenforce tablet cenforce 200
Richarddiree on said:
https://cenforce.cheap/# cenforce
MatthewSausy on said:
https://cenforce.cheap/# cenforce 200
MatthewSausy on said:
https://cenforce.cheap/# buy cheap cenforce
Williamsef on said:
lyrica pregabalin: buy generic lyrica – buy generic lyrica
Richarddiree on said:
https://cenforce.cheap/# cenforce 200
DonaldTic on said:
safe Provigil online delivery service order Provigil without prescription affordable Modafinil for cognitive enhancement
Davidviere on said:
https://cymbalta.top/# duloxetine
Richarddiree on said:
https://cymbalta.top/# cymbalta duloxetine
MatthewSausy on said:
https://modafinil.pro/# prescription-free Modafinil alternatives
DonaldTic on said:
lyrica price lyrica price cheap pregabalin
MatthewSausy on said:
https://cenforce.cheap/# buy cenforce
Richarddiree on said:
https://modafinil.pro/# Modafinil for focus and productivity
Davidviere on said:
https://cymbalta.top/# generic cymbalta
Richarddiree on said:
https://cymbalta.top/# cymbalta for pain
MatthewSausy on said:
https://cenforce.cheap/# cenforce price
Richarddiree on said:
https://pregabalin.life/# buy generic lyrica
MatthewSausy on said:
https://pregabalin.life/# buy generic lyrica
DonaldTic on said:
buy cymbalta online buy cymbalta online cymbalta medication
Williamsef on said:
Modafinil Pro: WakeMeds RX – prescription-free Modafinil alternatives
Richarddiree on said:
https://cenforce.cheap/# cenforce 200
Davidviere on said:
https://cymbalta.top/# cymbalta
MatthewSausy on said:
https://cenforce.cheap/# cenforce cheap
Richarddiree on said:
https://cenforce.cheap/# cenforce price
MatthewSausy on said:
https://pregabalin.life/# lyrica price
DonaldTic on said:
cenforce tablet cenforce tablet buy cheap cenforce
Richarddiree on said:
https://pregabalin.life/# lyrica generic
Davidviere on said:
https://cenforce.cheap/# cenforce tablet
Williamsef on said:
duloxetine easy buy: cymbalta medication – duloxetine
Richarddiree on said:
https://pregabalin.life/# cheap pregabalin
MatthewSausy on said:
https://modafinil.pro/# WakeMeds RX
MatthewSausy on said:
https://cenforce.cheap/# cenforce 200
Richarddiree on said:
https://pregabalin.life/# lyrica pregabalin
DonaldTic on said:
buy lyrica lyrica medication cheap pregabalin
Richarddiree on said:
https://cenforce.cheap/# cenforce tablet
Davidviere on said:
https://cenforce.cheap/# buy cheap cenforce
Williamsef on said:
pregabalin life: cheap pregabalin – lyrica online
MatthewSausy on said:
https://pregabalin.life/# buy lyrica
Richarddiree on said:
https://modafinil.pro/# affordable Modafinil for cognitive enhancement
MatthewSausy on said:
https://cenforce.cheap/# cenforce cheap
Richarddiree on said:
https://pregabalin.life/# lyrica medication
Davidviere on said:
https://cenforce.cheap/# cenforce tablet
Richarddiree on said:
https://cymbalta.top/# duloxetine
MatthewSausy on said:
https://pregabalin.life/# buy generic lyrica
Williamsef on said:
lyrica price: lyrica price – lyrica pregabalin
MatthewSausy on said:
https://cymbalta.top/# cymbalta duloxetine
Richarddiree on said:
https://cymbalta.top/# duloxetine
Patrickgroge on said:
https://medfrance.top/# Viagra pas cher livraison rapide france
WalterOnell on said:
farmacia barata farmacia online espaГ±a envГo internacional farmacia online envГo gratis
Kevinnab on said:
Viagra vente libre pays: Viagra pas cher livraison rapide france – Viagra femme sans ordonnance 24h
Patrickgroge on said:
https://medsmexican.blog/# farmacia mexicana en linea
WalterOnell on said:
pharmacia mexico phentermine in mexico pharmacy mail order pharmacy mexico
GeorgeJat on said:
farmacia online barcelona: farmacia online barata – п»їfarmacia online espaГ±a
Patrickgroge on said:
https://medmexico.online/# can i order online from a mexican pharmacy
GeorgeNug on said:
https://farmaciaspain.online/# п»їfarmacia online espaГ±a
Kevinnab on said:
farmacia online envÃo gratis: farmacia online envÃo gratis – farmacia online 24 horas
WalterOnell on said:
farmacia en casa online descuento farmacia online barata farmacias online seguras
Patrickgroge on said:
https://medmexico.online/# tijuana pharmacy online
WalterOnell on said:
Viagra homme prix en pharmacie sans ordonnance Viagra sans ordonnance 24h Amazon Prix du Viagra 100mg en France
Patrickgroge on said:
https://farmaciaspain.online/# farmacia online madrid
GeorgeJat on said:
farmacia online envГo gratis: farmacia online madrid – farmacia online espaГ±a envГo internacional
Patrickgroge on said:
https://medmexico.online/# can i order online from a mexican pharmacy
WalterOnell on said:
farmacias direct farmacias online baratas farmacia online envГo gratis
Kevinnab on said:
Viagra homme prix en pharmacie sans ordonnance: Viagra sans ordonnance 24h suisse – Viagra pas cher livraison rapide france
WalterOnell on said:
phentermine in mexico pharmacy farmacia mexicana online farmacia mexicana en linea
Patrickgroge on said:
https://farmaciaspain.online/# farmacia en casa online descuento
Patrickgroge on said:
https://medfrance.top/# SildГ©nafil 100mg pharmacie en ligne
GeorgeJat on said:
farmacia barata: farmacia online barata y fiable – farmacias direct
Kevinnab on said:
farmacia online envÃo gratis: farmacia en casa online descuento – farmacia online españa
WalterOnell on said:
Viagra en france livraison rapide Viagra sans ordonnance 24h suisse Viagra gГ©nГ©rique sans ordonnance en pharmacie
Patrickgroge on said:
https://farmaciaspain.online/# farmacias online baratas
WalterOnell on said:
farmacia online espaГ±a envГo internacional farmacia barata farmacia barata
Patrickgroge on said:
https://medmexico.online/# mexico pharmacy price list
GeorgeNug on said:
https://medsmexican.blog/# tijuana pharmacy online
WalterOnell on said:
mexican pharmacies that ship to the united states farmacias mexicanas pharmacies in mexico that ship to the us
GeorgeJat on said:
Viagra homme prix en pharmacie: Viagra sans ordonnance pharmacie France – Viagra Pfizer sans ordonnance
Patrickgroge on said:
https://farmaciasinreceta.top/# farmacia online espaГ±a envГo internacional
Kevinnab on said:
farmacia en casa online descuento: farmacias online seguras – farmacia online madrid
WalterOnell on said:
farmacia online envГo gratis farmacia online 24 horas farmacia online envГo gratis
Patrickgroge on said:
https://farmaciasinreceta.top/# farmacias online seguras
WalterOnell on said:
farmacia barata farmacia online madrid farmacia online barcelona
Kevinnab on said:
Viagra 100mg prix: Viagra homme prix en pharmacie sans ordonnance – Viagra vente libre allemagne
GeorgeJat on said:
Acheter viagra en ligne livraison 24h: Viagra homme prix en pharmacie sans ordonnance – Viagra pas cher livraison rapide france
Patrickgroge on said:
https://medmexico.online/# online drugs order
Patrickgroge on said:
https://medfrance.top/# Viagra 100 mg sans ordonnance
GeorgeNug on said:
https://farmaciaspain.online/# farmacias online baratas
WalterOnell on said:
buying prescriptions in mexico mexican mail order pharmacy pharmacies in mexico
Patrickgroge on said:
https://medfrance.top/# Quand une femme prend du Viagra homme
WalterOnell on said:
Viagra gГ©nГ©rique sans ordonnance en pharmacie Viagra 100 mg sans ordonnance SildГ©nafil Teva 100 mg acheter
Kevinnab on said:
Viagra 100mg prix: Prix du Viagra 100mg en France РViagra g̩n̩rique pas cher livraison rapide
GeorgeJat on said:
farmacia online espaГ±a envГo internacional: farmacia online 24 horas – farmacias direct
Patrickgroge on said:
https://farmaciasinreceta.top/# п»їfarmacia online espaГ±a
Patrickgroge on said:
https://medsmexican.blog/# best mexican pharmacy online
WalterOnell on said:
the purple pharmacy mexico mexico pharmacies farmacias mexicanas
WalterOnell on said:
farmacia online barata y fiable farmacia en casa online descuento farmacias direct
Patrickgroge on said:
https://farmaciaspain.online/# farmacia online barcelona
Patrickgroge on said:
https://farmaciasinreceta.top/# farmacia online espaГ±a envГo internacional
GeorgeJat on said:
Viagra pas cher inde: Viagra Pfizer sans ordonnance – Acheter viagra en ligne livraison 24h
WalterOnell on said:
farmacia online 24 horas farmacia online barata y fiable п»їfarmacia online espaГ±a
Patrickgroge on said:
https://medsmexican.blog/# mexico meds
WalterOnell on said:
Prix du Viagra en pharmacie en France Viagra 100 mg sans ordonnance Viagra femme ou trouver
Patrickgroge on said:
https://medfrance.top/# SildГ©nafil 100 mg sans ordonnance
Patrickgroge on said:
https://medfrance.top/# Viagra pas cher livraison rapide france
WalterOnell on said:
Viagra Pfizer sans ordonnance Prix du Viagra en pharmacie en France Viagra pas cher livraison rapide france
GeorgeNug on said:
https://medfrance.top/# Viagra pas cher inde
GeorgeJat on said:
farmacia en casa online descuento: farmacias online baratas – farmacia online envГo gratis
Patrickgroge on said:
https://medfrance.top/# Acheter Sildenafil 100mg sans ordonnance
WalterOnell on said:
farmacia online barata farmacias online seguras farmacia en casa online descuento
Patrickgroge on said:
https://medsmexican.blog/# pharmacia mexico
WalterOnell on said:
Viagra homme prix en pharmacie sans ordonnance Viagra homme prix en pharmacie sans ordonnance Viagra 100 mg sans ordonnance
Patrickgroge on said:
https://farmaciasinreceta.top/# farmacia online espaГ±a envГo internacional
WalterOnell on said:
Viagra pas cher livraison rapide france Viagra gГ©nГ©rique sans ordonnance en pharmacie Viagra prix pharmacie paris
Patrickgroge on said:
https://medsmexican.blog/# pharmacy in mexico city
Patrickgroge on said:
https://medfrance.top/# Viagra homme prix en pharmacie
WalterOnell on said:
farmacias online baratas farmacias online seguras en espaГ±a farmacia online barcelona
Patrickgroge on said:
https://medmexico.online/# mexican online pharmacy
GeorgeNug on said:
https://medfrance.top/# SildГ©nafil 100 mg prix en pharmacie en France
WalterOnell on said:
Quand une femme prend du Viagra homme Viagra sans ordonnance pharmacie France Viagra pas cher livraison rapide france
Patrickgroge on said:
https://medmexico.online/# meds from mexico
GeorgeJat on said:
farmacia online madrid: farmacia online barcelona – farmacia online barata
Patrickgroge on said:
https://medfrance.top/# Viagra vente libre allemagne
WalterOnell on said:
online pharmacy in mexico legitimate mexican pharmacy online farmacias mexicanas
Patrickgroge on said:
https://farmaciaspain.online/# farmacia online madrid
WalterOnell on said:
Viagra femme sans ordonnance 24h Viagra gГ©nГ©rique sans ordonnance en pharmacie SildГ©nafil 100 mg prix en pharmacie en France
Patrickgroge on said:
https://medmexico.online/# mexican drugstore
Patrickgroge on said:
https://farmaciasinreceta.top/# farmacias online seguras en espaГ±a
WalterOnell on said:
tijuana pharmacy online is mexipharmacy legit mexican pharmacy online
GeorgeJat on said:
farmacias online seguras en espaГ±a: farmacias online seguras en espaГ±a – farmacia online 24 horas
Patrickgroge on said:
https://farmaciaspain.online/# farmacias online baratas
WalterOnell on said:
good online mexican pharmacy mexican drug store online mexican pharmacies
Patrickgroge on said:
https://farmaciaspain.online/# farmacia online 24 horas
Patrickgroge on said:
https://medsmexican.blog/# farmacia pharmacy mexico purchase online
WalterOnell on said:
farmacia online madrid farmacias online seguras en espaГ±a farmacia online envГo gratis
GeorgeJat on said:
Viagra homme prix en pharmacie sans ordonnance: Prix du Viagra 100mg en France – Viagra homme prix en pharmacie sans ordonnance
Patrickgroge on said:
https://medmexico.online/# online pharmacy in mexico
WalterOnell on said:
farmacias online seguras farmacia online barata y fiable farmacia online barcelona
GeorgeNug on said:
https://farmaciasinreceta.top/# farmacias online seguras en espaГ±a
Patrickgroge on said:
https://medmexico.online/# online pharmacy mexico
Patrickgroge on said:
https://medfrance.top/# Le gГ©nГ©rique de Viagra
WalterOnell on said:
farmacias online seguras farmacia online madrid farmacia online barata y fiable
Patrickgroge on said:
https://medfrance.top/# Prix du Viagra 100mg en France
WalterOnell on said:
online mexico pharmacy mexican pharmacy prices mexican meds
GeorgeJat on said:
Viagra pas cher livraison rapide france: Viagra prix pharmacie paris – Viagra pas cher livraison rapide france
Patrickgroge on said:
https://medfrance.top/# SildГ©nafil Teva 100 mg acheter
Patrickgroge on said:
https://medmexico.online/# the purple pharmacy mexico
WalterOnell on said:
farmacias online seguras en espaГ±a п»їfarmacia online espaГ±a farmacias online baratas
Patrickgroge on said:
https://medmexico.online/# tijuana pharmacy online
WalterOnell on said:
mexican pharmacy ship to usa online drugs order online pharmacy mexico
GeorgeJat on said:
farmacia online barcelona: farmacia online barcelona – farmacia online envГo gratis
GeorgeNug on said:
https://medsmexican.blog/# mexican medicine
Patrickgroge on said:
https://farmaciasinreceta.top/# farmacia barata
Patrickgroge on said:
https://medmexico.online/# online pharmacy mexico
WalterOnell on said:
online pharmacy online pharmacies in mexico online pharmacies
Patrickgroge on said:
https://medfrance.top/# Prix du Viagra 100mg en France
Patrickgroge on said:
https://medfrance.top/# Prix du Viagra 100mg en France
GeorgeJat on said:
farmacias online seguras en espaГ±a: farmacia online barcelona – farmacia online barata
WalterOnell on said:
п»їfarmacia online espaГ±a farmacia online barata farmacia online barcelona
WalterOnell on said:
mexican pharmacy what to buy mexican rx mexican drug stores
Patrickgroge on said:
https://medmexico.online/# los algodones pharmacy online
Patrickgroge on said:
https://medmexico.online/# farmacias online usa
WalterOnell on said:
Viagra sans ordonnance 24h Amazon Viagra pas cher paris п»їViagra sans ordonnance 24h
Patrickgroge on said:
https://medmexico.online/# mexican pharmacies that ship to the united states
WalterOnell on said:
Viagra gГ©nГ©rique sans ordonnance en pharmacie Viagra homme sans ordonnance belgique Viagra pas cher inde
gate io konto on said:
Can you be more specific about the content of your article? After reading it, I still have some doubts. Hope you can help me.
Patrickgroge on said:
https://farmaciasinreceta.top/# farmacias online seguras
GeorgeNug on said:
https://farmaciasinreceta.top/# farmacia online envГo gratis
Patrickgroge on said:
https://farmaciaspain.online/# farmacia en casa online descuento
Patrickgroge on said:
https://farmaciaspain.online/# farmacias online seguras
GeorgeJat on said:
Viagra pas cher livraison rapide france: Viagra 100 mg sans ordonnance – Viagra prix pharmacie paris
EdmundSlAsk on said:
farmacia online madrid farmacias direct farmacia en casa online descuento
EdmundSlAsk on said:
online mexican pharmacies mexican pharmacies that ship mexican pharmacy prices
PhillipENART on said:
https://pharmustomex.top/# my mexican pharmacy
Robertrog on said:
farmacia online madrid: farmacia online españa envÃo internacional – farmacias online seguras en españa
PhillipENART on said:
https://pharmmxus.online/# online mexican pharmacy
EdmundSlAsk on said:
mexico online farmacia farmacia online usa pharmacy in mexico
EugeneMon on said:
farmacias online baratas: farmacias online seguras en espaГ±a – farmacia online 24 horas
EdmundSlAsk on said:
farmacias online seguras en espaГ±a farmacia online madrid farmacias online seguras
PhillipENART on said:
https://frpharmacies.icu/# Viagra 100 mg sans ordonnance
CarlosBiort on said:
https://frpharmacies.icu/# Prix du Viagra 100mg en France
PhillipENART on said:
https://frpharmacies.icu/# Viagra homme prix en pharmacie
EdmundSlAsk on said:
mexican online pharmacy wegovy mexican pharmacies that ship to the united states reputable mexican pharmacy
Robertrog on said:
farmacias direct: farmacia online envÃo gratis – farmacias direct
PhillipENART on said:
https://frpharmacies.icu/# Le gГ©nГ©rique de Viagra
EdmundSlAsk on said:
Viagra sans ordonnance 24h suisse Viagra prix pharmacie paris Viagra pas cher livraison rapide france
EugeneMon on said:
Viagra pas cher livraison rapide france: Viagra homme prix en pharmacie sans ordonnance – Viagra sans ordonnance pharmacie France
PhillipENART on said:
https://frpharmacies.icu/# Viagra 100mg prix
Robertrog on said:
pharmacy in mexico: mexican medicine store – mexico pharmacy price list
PhillipENART on said:
https://pharmmxus.online/# meds from mexico
EdmundSlAsk on said:
farmacia pharmacy mexico best mexican pharmacy purple pharmacy online
EdmundSlAsk on said:
mexican rx pharm best mexican pharmacy online mexicanrxpharm
EugeneMon on said:
my mexican pharmacy: medication in mexico – mexican pharmacies that ship
PhillipENART on said:
https://pharmmxus.online/# mexican pharmacies online
PhillipENART on said:
https://farmaciabarc.online/# farmacias online baratas
EdmundSlAsk on said:
farmacias online seguras farmacia online madrid farmacia online barata
Robertrog on said:
farmacia en casa online descuento: farmacia online 24 horas – farmacia online barata
PhillipENART on said:
https://farmaciabarc.online/# farmacias online baratas
EdmundSlAsk on said:
purple pharmacy purple pharmacy mexican online pharmacies
CarlosBiort on said:
https://farmaciaes.top/# п»їfarmacia online espaГ±a
PhillipENART on said:
https://farmaciaes.top/# farmacia online madrid
Robertrog on said:
farmacia online madrid: farmacia online españa – farmacia online envÃo gratis
PhillipENART on said:
https://pharmmxus.online/# purple pharmacy online ordering
EdmundSlAsk on said:
farmacia online madrid farmacia barata farmacia online barcelona
EdmundSlAsk on said:
Viagra en france livraison rapide Acheter viagra en ligne livraison 24h Viagra vente libre pays
PhillipENART on said:
https://pharmmxus.online/# mexico pharmacies
EugeneMon on said:
pharmacy in mexico that ships to us: mexipharmacy reviews – farmacias mexicanas
PhillipENART on said:
https://pharmustomex.top/# mexican pharmacy near me
Robertrog on said:
mexico drug store online: pharmacies in mexico that ship to the us – online pharmacies
EdmundSlAsk on said:
farmacia online madrid farmacias online seguras farmacia barata
PhillipENART on said:
https://frpharmacies.icu/# Sildenafil teva 100 mg sans ordonnance
EdmundSlAsk on said:
Viagra vente libre pays Viagra pas cher inde Viagra sans ordonnance 24h Amazon
CarlosBiort on said:
https://pharmustomex.top/# pharmacy delivery
PhillipENART on said:
https://frpharmacies.icu/# Viagra sans ordonnance livraison 24h
Robertrog on said:
farmacia online españa: farmacia online 24 horas – farmacia barata
EugeneMon on said:
farmacia online espaГ±a envГo internacional: farmacia online espaГ±a envГo internacional – farmacias online baratas
PhillipENART on said:
https://frpharmacies.icu/# Prix du Viagra en pharmacie en France
EdmundSlAsk on said:
mexico medicine online pharmacies mexico pharmacy online
EdmundSlAsk on said:
Viagra sans ordonnance pharmacie France Meilleur Viagra sans ordonnance 24h Viagra sans ordonnance 24h suisse
PhillipENART on said:
https://pharmustomex.top/# farmacia pharmacy mexico
PhillipENART on said:
https://frpharmacies.icu/# Quand une femme prend du Viagra homme
Robertrog on said:
Viagra sans ordonnance 24h suisse: Sild̩nafil 100 mg sans ordonnance РQuand une femme prend du Viagra homme
EugeneMon on said:
Viagra prix pharmacie paris: Sildenafil teva 100 mg sans ordonnance – Prix du Viagra en pharmacie en France
EdmundSlAsk on said:
Prix du Viagra 100mg en France Viagra homme sans ordonnance belgique Viagra sans ordonnance 24h Amazon
PhillipENART on said:
https://pharmmxus.online/# pharmacy in mexico online
EdmundSlAsk on said:
farmacias online seguras en espaГ±a farmacia online espaГ±a envГo internacional farmacia online envГo gratis
PhillipENART on said:
https://pharmustomex.top/# mexican pharmacies that ship to us
Robertrog on said:
Sildenafil teva 100 mg sans ordonnance: Viagra homme sans ordonnance belgique – Viagra vente libre allemagne
PhillipENART on said:
https://frpharmacies.icu/# Sildenafil teva 100 mg sans ordonnance
EdmundSlAsk on said:
farmacias online seguras en espaГ±a farmacia online 24 horas farmacia online madrid
EdmundSlAsk on said:
online mexican pharmacy mexipharmacy reviews worldwide pharmacy
CarlosBiort on said:
https://farmaciabarc.online/# farmacia online 24 horas
PhillipENART on said:
https://pharmmxus.online/# farmacia mexicana en linea
Robertrog on said:
farmacia online envÃo gratis: farmacia online envÃo gratis – farmacia online barcelona
EdmundSlAsk on said:
mexi pharmacy progreso mexico pharmacy online pharmacy in mexico online
PhillipENART on said:
https://farmaciabarc.online/# farmacia online barata
EugeneMon on said:
SildГ©nafil 100mg pharmacie en ligne: Viagra sans ordonnance pharmacie France – Viagra 100 mg sans ordonnance
Robertrog on said:
legitimate mexican pharmacy online: mexico online farmacia – purple pharmacy online ordering
PhillipENART on said:
https://pharmustomex.top/# mexican pharmacy prices
PhillipENART on said:
https://pharmustomex.top/# farmacia pharmacy mexico
EdmundSlAsk on said:
mexican pharmacy what to buy mexican pharmacy online medications medication from mexico
EdmundSlAsk on said:
mexico online pharmacy pharmacy in mexico that ships to us mexico pharmacy order online
PhillipENART on said:
https://farmaciabarc.online/# farmacia online barcelona
CarlosBiort on said:
https://pharmustomex.top/# mexican online pharmacy wegovy
EugeneMon on said:
Viagra Pfizer sans ordonnance: Viagra pas cher paris – Viagra vente libre allemagne
Robertrog on said:
the purple pharmacy mexico: online pharmacies – worldwide pharmacy
PhillipENART on said:
https://frpharmacies.icu/# Viagra gГ©nГ©rique sans ordonnance en pharmacie
EdmundSlAsk on said:
farmacia online barcelona farmacia online barata farmacia online barcelona
PhillipENART on said:
https://frpharmacies.icu/# Viagra sans ordonnance 24h Amazon
EdmundSlAsk on said:
п»їfarmacia online espaГ±a farmacia barata farmacia online envГo gratis
Robertrog on said:
Viagra générique pas cher livraison rapide: Viagra sans ordonnance 24h – Acheter viagra en ligne livraison 24h
PhillipENART on said:
https://frpharmacies.icu/# Viagra femme sans ordonnance 24h
EugeneMon on said:
farmacias online seguras en espaГ±a: farmacia online barcelona – farmacias online seguras
PhillipENART on said:
https://pharmmxus.online/# los algodones pharmacy online
EdmundSlAsk on said:
Viagra sans ordonnance livraison 24h Viagra pas cher livraison rapide france SildГ©nafil Teva 100 mg acheter
PhillipENART on said:
https://frpharmacies.icu/# Viagra prix pharmacie paris
EdmundSlAsk on said:
order from mexico los algodones pharmacy online mexican mail order pharmacy
Robertrog on said:
hydrocodone mexico pharmacy: mexico farmacia – order antibiotics from mexico
PhillipENART on said:
https://frpharmacies.icu/# Acheter viagra en ligne livraison 24h
EugeneMon on said:
SildГ©nafil 100 mg prix en pharmacie en France: Viagra en france livraison rapide – Sildenafil teva 100 mg sans ordonnance
EdmundSlAsk on said:
Viagra femme ou trouver Viagra vente libre pays Viagra 100mg prix
PhillipENART on said:
https://farmaciabarc.online/# farmacia online madrid
EdmundSlAsk on said:
farmacias online seguras farmacia en casa online descuento farmacias online baratas
Robertrog on said:
mexican pharmacies that ship to the united states: mexican mail order pharmacy – mexican pharma
PhillipENART on said:
https://pharmustomex.top/# mexican pharmacies near me
Larrypon on said:
canadian pharmacy antibiotics: MedNavigator – onlinecanadianpharmacy 24
NormansmeaK on said:
http://saludbridgepharmacy.com/# mexican mail order pharmacy
Keithimpof on said:
https://saludbridgepharmacy.shop/# can i buy meds from mexico online
Williametepe on said:
SaludBridge Pharmacy SaludBridge Pharmacy SaludBridge Pharmacy
NormansmeaK on said:
https://saludbridgepharmacy.shop/# SaludBridge Pharmacy
Keithimpof on said:
https://novaformpharmacy.shop/# cheapest online pharmacy india
Larrypon on said:
SaludBridge: SaludBridge Pharmacy – SaludBridge
Brycefut on said:
SaludBridge: SaludBridge Pharmacy – SaludBridge
Larrypon on said:
SaludBridge Pharmacy: SaludBridge Pharmacy – SaludBridge Pharmacy
NormansmeaK on said:
http://mednavigatorpharmacys.com/# MedNavigator Pharmacy
Keithimpof on said:
https://novaformpharmacy.shop/# india pharmacy mail order
Williametepe on said:
mexico meds SaludBridge Pharmacy pharmacy in mexico
Keithimpof on said:
https://saludbridgepharmacy.shop/# SaludBridge Pharmacy
NormansmeaK on said:
http://mednavigatorpharmacys.com/# MedNavigator
Brycefut on said:
indian pharmacy paypal: NovaForm – overseas online pharmacy
Larrypon on said:
reputable indian online pharmacy: Online medicine home delivery – reputable online pharmacy no prescription
Keithimpof on said:
http://saludbridgepharmacy.com/# can i buy meds from mexico online
Larrypon on said:
SaludBridge: SaludBridge Pharmacy – SaludBridge
NormansmeaK on said:
https://novaformpharmacy.com/# indian pharmacy online
Williametepe on said:
MedNavigator Pharmacy MedNavigator canadianpharmacy com
Keithimpof on said:
https://mednavigatorpharmacys.com/# MedNavigator Pharmacy
NormansmeaK on said:
https://saludbridgepharmacy.shop/# SaludBridge Pharmacy
Brycefut on said:
MedNavigator Pharmacy: canadianpharmacymeds com – MedNavigator
Larrypon on said:
MedNavigator Pharmacy: MedNavigator – MedNavigator Pharmacy
Keithimpof on said:
https://saludbridgepharmacy.shop/# SaludBridge
Larrypon on said:
indian pharmacy online: NovaForm – buy online medicine
Williametepe on said:
SaludBridge Pharmacy order from mexico SaludBridge Pharmacy
NormansmeaK on said:
http://novaformpharmacy.com/# buy medicines online in india
Keithimpof on said:
http://saludbridgepharmacy.com/# SaludBridge
Brycefut on said:
SaludBridge: SaludBridge Pharmacy – mexican pharmacies
NormansmeaK on said:
http://novaformpharmacy.com/# indian pharmacy paypal
Keithimpof on said:
http://mednavigatorpharmacys.com/# MedNavigator
Larrypon on said:
SaludBridge Pharmacy: SaludBridge – SaludBridge Pharmacy
Williametepe on said:
cheapest online pharmacy india NovaForm Pharmacy trustworthy online pharmacy
Larrypon on said:
SaludBridge: SaludBridge – can i order online from a mexican pharmacy
Keithimpof on said:
https://novaformpharmacy.shop/# indian pharmacy online
NormansmeaK on said:
https://saludbridgepharmacy.com/# SaludBridge
Keithimpof on said:
http://novaformpharmacy.com/# top online pharmacy india
NormansmeaK on said:
http://saludbridgepharmacy.com/# SaludBridge Pharmacy
Brycefut on said:
SaludBridge: SaludBridge Pharmacy – SaludBridge Pharmacy
Larrypon on said:
mexico city pharmacy: SaludBridge Pharmacy – mexican drug stores
Williametepe on said:
SaludBridge Pharmacy SaludBridge the purple pharmacy mexico
Keithimpof on said:
http://saludbridgepharmacy.com/# SaludBridge
Larrypon on said:
safe online pharmacies in canada: canada drugs – MedNavigator
NormansmeaK on said:
http://novaformpharmacy.com/# cheapest online pharmacy india
Keithimpof on said:
https://novaformpharmacy.com/# online shopping pharmacy india
Brycefut on said:
online pharmacy india: NovaForm Pharmacy – overseas online pharmacy
NormansmeaK on said:
http://saludbridgepharmacy.com/# SaludBridge
Williametepe on said:
Online medicine order NovaForm shop medicine online
Larrypon on said:
SaludBridge: SaludBridge – SaludBridge
Keithimpof on said:
https://novaformpharmacy.com/# top 10 pharmacies in india
Larrypon on said:
mexico rx: SaludBridge Pharmacy – SaludBridge
Keithimpof on said:
https://mednavigatorpharmacys.com/# MedNavigator
NormansmeaK on said:
https://novaformpharmacy.shop/# best india pharmacy
Brycefut on said:
SaludBridge: mexican pharma – SaludBridge
Keithimpof on said:
https://saludbridgepharmacy.com/# SaludBridge
NormansmeaK on said:
https://mednavigatorpharmacys.com/# MedNavigator
Williametepe on said:
canadian drug pharmacy MedNavigator MedNavigator Pharmacy
Larrypon on said:
canadian pharmacy antibiotics: MedNavigator Pharmacy – MedNavigator Pharmacy
Larrypon on said:
Online medicine home delivery: reputable indian online pharmacy – legit online pharmacy
Keithimpof on said:
https://novaformpharmacy.com/# top online pharmacy india
NormansmeaK on said:
https://novaformpharmacy.shop/# india online pharmacy
Brycefut on said:
best online pharmacy india: NovaForm Pharmacy – best online pharmacy no prescription
Keithimpof on said:
http://saludbridgepharmacy.com/# SaludBridge
NormansmeaK on said:
http://novaformpharmacy.com/# п»їlegitimate online pharmacies india
Larrypon on said:
canadian king pharmacy: MedNavigator – MedNavigator Pharmacy
Keithimpof on said:
https://novaformpharmacy.com/# online pharmacy india
Larrypon on said:
top online pharmacy india: п»їlegitimate online pharmacies india – online pharmacy discount code
NormansmeaK on said:
https://novaformpharmacy.com/# indianpharmacy com
Keithimpof on said:
https://mednavigatorpharmacys.shop/# MedNavigator
Williametepe on said:
SaludBridge Pharmacy SaludBridge Pharmacy SaludBridge
Brycefut on said:
indian pharmacy online: india pharmacy mail order – online pharmacy no rx
NormansmeaK on said:
https://mednavigatorpharmacys.shop/# MedNavigator
Larrypon on said:
india pharmacy: NovaForm Pharmacy – secure medical online pharmacy
Keithimpof on said:
http://novaformpharmacy.com/# indian pharmacy online
Keithimpof on said:
http://mednavigatorpharmacys.com/# canadian online drugstore
NormansmeaK on said:
http://saludbridgepharmacy.com/# SaludBridge Pharmacy
Brycefut on said:
MedNavigator: canadian online pharmacy – canadian pharmacy tampa
Williametepe on said:
SaludBridge Pharmacy SaludBridge SaludBridge
Keithimpof on said:
http://mednavigatorpharmacys.com/# canadian drugs
NormansmeaK on said:
https://mednavigatorpharmacys.shop/# MedNavigator Pharmacy
Larrypon on said:
drugs from canada: my canadian pharmacy reviews – MedNavigator Pharmacy
Larrypon on said:
п»їlegitimate online pharmacies india: online pharmacy india – reputable online pharmacy no prescription
Keithimpof on said:
https://novaformpharmacy.shop/# buy prescription drugs from india
NormansmeaK on said:
https://saludbridgepharmacy.shop/# SaludBridge Pharmacy
Williametepe on said:
Online medicine order NovaForm safe online pharmacies
Brycefut on said:
buy prescription drugs from india: buy prescription drugs from india – top online pharmacy
Keithimpof on said:
https://novaformpharmacy.shop/# world pharmacy india
NormansmeaK on said:
http://saludbridgepharmacy.com/# pharmacies in mexico
Larrypon on said:
MedNavigator: MedNavigator Pharmacy – safe canadian pharmacies
Keithimpof on said:
https://saludbridgepharmacy.com/# online pharmacy
Larrypon on said:
SaludBridge: SaludBridge – can i buy meds from mexico online
Brycefut on said:
cheap canadian pharmacy: MedNavigator – MedNavigator Pharmacy
NormansmeaK on said:
https://saludbridgepharmacy.com/# SaludBridge Pharmacy
Keithimpof on said:
https://saludbridgepharmacy.com/# SaludBridge Pharmacy
Williametepe on said:
MedNavigator canadian valley pharmacy MedNavigator Pharmacy
NormansmeaK on said:
https://novaformpharmacy.shop/# Online medicine order
Larrypon on said:
mail order pharmacy india: NovaForm Pharmacy – reputable online pharmacy no prescription
Keithimpof on said:
https://mednavigatorpharmacys.shop/# MedNavigator Pharmacy
Larrypon on said:
indian pharmacy online: NovaForm – worldwide pharmacy online
Keithimpof on said:
http://mednavigatorpharmacys.com/# canadian drug
NormansmeaK on said:
https://novaformpharmacy.com/# india pharmacy mail order
Brycefut on said:
reputable indian pharmacies: NovaForm Pharmacy – reputable online pharmacy no prescription
Williametepe on said:
SaludBridge Pharmacy SaludBridge Pharmacy SaludBridge Pharmacy
Keithimpof on said:
https://mednavigatorpharmacys.shop/# MedNavigator
NormansmeaK on said:
https://saludbridgepharmacy.com/# SaludBridge
Larrypon on said:
п»їlegitimate online pharmacies india: NovaForm – international pharmacy
Larrypon on said:
MedNavigator: canadian family pharmacy – MedNavigator
Keithimpof on said:
https://novaformpharmacy.shop/# indian pharmacy paypal
Brycefut on said:
mexipharmacy reviews: purple pharmacy online – SaludBridge
NormansmeaK on said:
https://saludbridgepharmacy.shop/# SaludBridge
TravisWholi on said:
https://mexicohealth.top/# order meds from mexico
Ernestjem on said:
SildГ©nafil Teva 100 mg acheter Viagra prix pharmacie paris Viagra gГ©nГ©rique sans ordonnance en pharmacie
Timothyaidet on said:
https://farmaciabarca.top/# farmacias online baratas
Jeffreycop on said:
farmacia online 24 horas: farmacia online envГo gratis – farmacia online 24 horas
TravisWholi on said:
http://farmaciaestop.online/# farmacias online seguras
Jeffreycop on said:
Viagra sans ordonnance livraison 48h: Viagra sans ordonnance livraison 24h – Viagra Pfizer sans ordonnance
Timothyaidet on said:
https://farmaciabarca.top/# farmacia online 24 horas
TravisWholi on said:
http://farmaciaesptop.online/# farmacia online barata y fiable
Alfredabuby on said:
http://mexicanpharmfast.online/# mexico city pharmacy
Ernestjem on said:
Viagra homme prix en pharmacie Viagra pas cher paris Viagra homme prix en pharmacie sans ordonnance
Timothyaidet on said:
https://francepharmacies.icu/# Meilleur Viagra sans ordonnance 24h
Jeffreycop on said:
Viagra homme sans ordonnance belgique: Viagra gГ©nГ©rique sans ordonnance en pharmacie – SildГ©nafil 100mg pharmacie en ligne
TravisWholi on said:
https://francepharmacies.icu/# Viagra gГ©nГ©rique sans ordonnance en pharmacie
Jeffreycop on said:
Viagra vente libre allemagne: Viagra sans ordonnance 24h suisse – Prix du Viagra en pharmacie en France
TravisWholi on said:
https://mxhealthrate.icu/# pharmacy mexico city
Timothyaidet on said:
https://mexicohealth.top/# mexican farmacia
Alfredabuby on said:
https://mxhealthrate.icu/# online pharmacy
Timothyaidet on said:
https://mexicohealth.top/# mexican drug stores
TravisWholi on said:
http://farmaciaestop.online/# п»їfarmacia online espaГ±a
Jeffreycop on said:
п»їfarmacia online espaГ±a: farmacia en casa online descuento – farmacia online envГo gratis
Jeffreycop on said:
farmacia online barcelona: farmacia online envГo gratis – farmacias online seguras
TravisWholi on said:
https://farmaciabarca.top/# farmacia en casa online descuento
Timothyaidet on said:
https://mxhealthrate.icu/# the purple pharmacy mexico
Ernestjem on said:
mexico pharmacy order online mexico prescriptions buy drugs online
TravisWholi on said:
https://farmaciabarca.top/# farmacia online madrid
Alfredabuby on said:
https://mexicohealth.top/# farmacia pharmacy mexico purchase online
Timothyaidet on said:
http://mexicanpharmfast.online/# mexico medication
TravisWholi on said:
https://francepharmacies.icu/# Viagra homme prix en pharmacie sans ordonnance
Jeffreycop on said:
the purple pharmacy mexico: best online mexican pharmacy – online pharmacies
Timothyaidet on said:
http://farmaciaestop.online/# farmacias direct
Alfredabuby on said:
http://farmaciaestop.online/# farmacia online envÃo gratis
TravisWholi on said:
https://francepharmacies.icu/# Viagra homme sans prescription
Ernestjem on said:
farmacias online seguras en espaГ±a farmacia online madrid farmacia online barata
Timothyaidet on said:
https://francepharmacies.icu/# Quand une femme prend du Viagra homme
Jeffreycop on said:
los algodones pharmacy online: order meds from mexico – order meds from mexico
Jeffreycop on said:
farmacias online seguras: п»їfarmacia online espaГ±a – farmacias direct
TravisWholi on said:
http://mexicanpharmfast.online/# mexico meds
Timothyaidet on said:
https://francepharmacies.icu/# Viagra gГ©nГ©rique pas cher livraison rapide
Ernestjem on said:
Meilleur Viagra sans ordonnance 24h Viagra homme sans ordonnance belgique Viagra pas cher paris
TravisWholi on said:
https://francepharmacies.icu/# SildГ©nafil Teva 100 mg acheter
MillardNut on said:
https://generixpharm.shop/clomid-clomiphene-mechanisms/# how to get cheap clomid without a prescription
Timothyaidet on said:
https://farmaciabarca.top/# farmacia online madrid
Jeffreycop on said:
farmacia online barcelona: farmacia en casa online descuento – farmacia online madrid
TravisWholi on said:
http://farmaciaestop.online/# farmacias direct
Jeffreycop on said:
farmacia online envГo gratis: farmacias direct – farmacia online envГo gratis
Timothyaidet on said:
https://francepharmacies.icu/# Viagra pas cher livraison rapide france
MillardNut on said:
https://generixpharm.shop/cytotec-misoprostol-guidelines/# Generix Pharm
TravisWholi on said:
http://farmaciaestop.online/# farmacia barata
Ernestjem on said:
pharmacy in mexico online medicine from mexico is mexipharmacy legit
Timothyaidet on said:
http://mexicanpharmfast.online/# buy drugs online
TravisWholi on said:
http://farmaciaestop.online/# farmacias direct
Jeffreycop on said:
farmacias online seguras en espaГ±a: п»їfarmacia online espaГ±a – farmacias online seguras en espaГ±a
Timothyaidet on said:
https://farmaciabarca.top/# farmacias online seguras
Jeffreycop on said:
Viagra pas cher livraison rapide france: Viagra gГ©nГ©rique sans ordonnance en pharmacie – Viagra homme sans ordonnance belgique
TravisWholi on said:
https://mxhealthrate.icu/# progreso, mexico pharmacy online
MillardNut on said:
https://generixpharm.shop/clomid-clomiphene-mechanisms/# order generic clomid online
RalphDab on said:
https://paydaybesthub.online/# best and quickest payday loans
Michaelneura on said:
https://paydaybesthub.shop/# get payday loan online today
Carrollmaife on said:
instant cash advance online Payday Best Hub online payday loans
EduardoBourl on said:
cash advance online no fax: loans online instant approval with no credit – quickest payday loans online
Michaelneura on said:
http://paydaybesthub.com/# best acceptance payday loans
RalphDab on said:
https://paydaybesthub.com/# reputable payday loan lenders
EduardoBourl on said:
most trusted payday loans online: loans till payday everyone approved – always approved payday loans
MillardNut on said:
https://generixpharm.shop/propecia-finasteride-data/# GenerixPharm
Michaelneura on said:
http://paydaybesthub.com/# get a cash advance immediately
Carrollmaife on said:
payday loans online same day PaydayBestHub payday loans online with instant approval
RalphDab on said:
http://paydaybesthub.com/# payday loans online no interest
Michaelneura on said:
http://paydaybesthub.com/# most trusted payday loan sites
EduardoBourl on said:
payday loans online: Payday Best Hub – most trusted payday loan sites
RalphDab on said:
https://paydaybesthub.online/# cash advance no interest
EduardoBourl on said:
instant cash advance online no credit check: PaydayBestHub – п»їpayday loans
MillardNut on said:
https://generixpharm.shop/clomid-clomiphene-mechanisms/# can i get cheap clomid without prescription
Carrollmaife on said:
always approved payday loans PaydayBestHub reputable payday loan lenders
RalphDab on said:
https://paydaybesthub.shop/# most trusted payday loan sites
Michaelneura on said:
http://paydaybesthub.com/# instant cash advance no fee
EduardoBourl on said:
quickest payday loans online: Payday Best Hub – everyone approved payday loan
RalphDab on said:
https://paydaybesthub.com/# quickest payday loans online
EduardoBourl on said:
payday loans online with instant approval: Payday Best Hub – payday loans online no interest
Michaelneura on said:
https://paydaybesthub.online/# reputable payday loan lenders
MillardNut on said:
https://generixpharm.shop/seroquel-quetiapine-profile/# generic seroquel
Carrollmaife on said:
cash advance no interest payday loans direct lenders instant cash advance no fee
RalphDab on said:
http://paydaybesthub.com/# п»їpayday loans
Michaelneura on said:
https://paydaybesthub.shop/# payday cash advance online
EduardoBourl on said:
most trusted payday loan sites: Payday Best Hub – best payday advance loans online
Michaelneura on said:
https://paydaybesthub.com/# online payday loans
RalphDab on said:
https://paydaybesthub.shop/# payday loans online loan
Carrollmaife on said:
payday loans no interest Payday Best Hub cash advance online no fax
Michaelneura on said:
http://paydaybesthub.com/# everyone approved payday loan
MillardNut on said:
https://generixpharm.shop/lasix-furosemide-protocols/# furosemide 100mg
RalphDab on said:
https://paydaybesthub.shop/# actual payday loan lenders online
Michaelneura on said:
https://paydaybesthub.com/# instant cash advance no fee
EduardoBourl on said:
cash advance online no fax: get payday loan online today – most trusted payday loans online
EduardoBourl on said:
reputable payday loan lenders: payday loans no interest – instant cash advance online
RalphDab on said:
https://paydaybesthub.com/# best approval payday loans
Carrollmaife on said:
payday loans online apply Payday Best Hub payday loans online instantly
MillardNut on said:
https://generixpharm.shop/cytotec-misoprostol-guidelines/# buy cytotec online fast delivery
Michaelneura on said:
https://paydaybesthub.online/# payday loans online apply
RalphDab on said:
https://paydaybesthub.shop/# best reliable payday loans
Michaelneura on said:
https://paydaybesthub.com/# payday cash advance online
EduardoBourl on said:
payday loans online no interest: PaydayBestHub – loans till payday everyone approved
Michaelneura on said:
https://paydaybesthub.shop/# payday loans online with instant approval
Carrollmaife on said:
best approval payday loans PaydayBestHub payday loans
MillardNut on said:
https://generixpharm.shop/propecia-finasteride-data/# Generix Pharm
Michaelneura on said:
https://paydaybesthub.online/# everyone approved payday loan
RalphDab on said:
http://paydaybesthub.com/# actual payday loan lenders online
EduardoBourl on said:
most reputable payday loans: PaydayBestHub – most reliable payday loan company
Michaelneura on said:
https://paydaybesthub.com/# payday loans online with instant approval
Carrollmaife on said:
best payday advance loans online PaydayBestHub payday loans online instantly
RalphDab on said:
https://paydaybesthub.shop/# payday loans online no credit
EduardoBourl on said:
best approval payday loans: PaydayBestHub – payday loans online with instant approval
MillardNut on said:
https://generixpharm.shop/lasix-furosemide-protocols/# lasix dosage
Michaelneura on said:
https://paydaybesthub.online/# get a cash advance immediately
RalphDab on said:
https://paydaybesthub.online/# reputable payday loan lenders
Michaelneura on said:
https://paydaybesthub.com/# most reliable payday loan company
EduardoBourl on said:
instant cash advance online no credit check: payday loans online same day – loans online instant approval with no credit
EduardoBourl on said:
cash advance online no fax: most trusted payday loan sites – instant cash advance no fee
Carrollmaife on said:
payday cash advance online Payday Best Hub payday cash advance online
Michaelneura on said:
https://paydaybesthub.online/# always approved payday loans
RalphDab on said:
http://paydaybesthub.com/# most reputable payday loan companies
MillardNut on said:
https://generixpharm.shop/clomid-clomiphene-mechanisms/# Generix Pharm
Michaelneura on said:
http://paydaybesthub.com/# best and quickest payday loans
EduardoBourl on said:
paycheck advance online: payday loans no interest – get payday loan online today
Michaelneura on said:
https://paydaybesthub.online/# most reliable payday loan company
RalphDab on said:
https://paydaybesthub.online/# instant cash advance no fee
EduardoBourl on said:
most trusted payday loan sites: actual payday loan lenders online – payday loans no interest
Carrollmaife on said:
most trusted payday loans online best acceptance payday loans payday loans no credit check
MillardNut on said:
https://generixpharm.shop/lasix-furosemide-protocols/# furosemide 100mg
Michaelneura on said:
https://paydaybesthub.shop/# loans online instant approval with no credit
RalphDab on said:
http://paydaybesthub.com/# quickest payday loans online
EduardoBourl on said:
best acceptance payday loans: most trusted payday loans online – most reputable payday loan companies
Michaelneura on said:
https://paydaybesthub.shop/# best approval payday loans
RalphDab on said:
http://paydaybesthub.com/# instant cash advance no fee
EduardoBourl on said:
best acceptance payday loans: best payday advance loans online – paycheck advance online
Carrollmaife on said:
payday loans direct lenders Payday Best Hub payday loans that approve everyone
RalphDab on said:
http://paydaybesthub.com/# best and quickest payday loans
MillardNut on said:
https://generixpharm.shop/cytotec-misoprostol-guidelines/# GenerixPharm
Michaelneura on said:
https://paydaybesthub.com/# actual payday loan lenders online
EduardoBourl on said:
loans till payday everyone approved: payday loans no credit check – payday loans online with instant approval
EduardoBourl on said:
best reliable payday loans: PaydayBestHub – best reliable payday loans
Michaelneura on said:
http://paydaybesthub.com/# cash advance no interest
Carrollmaife on said:
payday loans online PaydayBestHub payday loans online instantly
RalphDab on said:
http://paydaybesthub.com/# always approved payday loans
MillardNut on said:
https://generixpharm.shop/# GenerixPharm Research Group
Michaelneura on said:
https://paydaybesthub.shop/# best approval payday loans
EduardoBourl on said:
payday loans online no credit: PaydayBestHub – get payday loan online today
Michaelneura on said:
https://paydaybesthub.com/# payday cash advance online
EduardoBourl on said:
most reputable payday loans: online payday loans – cash advance online no fax
RalphDab on said:
https://paydaybesthub.shop/# paycheck advance online
Michaelneura on said:
https://paydaybesthub.online/# instant cash advance no fee
Carrollmaife on said:
most trusted payday loans online reputable payday loan lenders payday loans no credit check
RalphDab on said:
https://paydaybesthub.shop/# loans online instant approval with no credit
Michaelneura on said:
http://paydaybesthub.com/# online payday loans
EduardoBourl on said:
actual payday loan lenders online: best reliable payday loans – cash advance online no fax
DouglasPar on said:
https://lacefieldurology.com/# what is the cheapest ed medication
ArthurTef on said:
Farmacia online envío gratis: Efrain Villalobos Verduzco – Farmacia online envío gratis
BrandonavaVy on said:
https://lacefieldurology.shop/# ed doctor online
WilliamAmuro on said:
ed drugs online Dr Lacefield overseas pharmacy no prescription
DouglasPar on said:
http://pediatraefrainvillalobos.com/# Farmacia online España
BrandonavaVy on said:
https://ucipediatriatoledo.com/# viagra
ArthurTef on said:
farmacia barata: farmacia online barata – farmacia online barata
BrandonavaVy on said:
https://pediatraefrainvillalobos.com/# farmacia online
ArthurTef on said:
Viagra genérica sin receta: Viagra precio sin receta – Comprar Viagra online seguro
DouglasPar on said:
http://pediatraefrainvillalobos.com/# Farmacia online España
BrandonavaVy on said:
https://pediatraefrainvillalobos.com/# Efrain Villalobos Verduzco
WilliamAmuro on said:
ed medications online Lacefield Urology no rx needed pharmacy
DouglasPar on said:
http://pediatraefrainvillalobos.com/# farmacia online barata
ArthurTef on said:
buying erectile dysfunction pills online: Lacefield Urology – secure medical online pharmacy
BrandonavaVy on said:
https://lacefieldurology.shop/# cost of ed meds
ArthurTef on said:
Pediatra Efrain Villalobos: farmacia online – Farmacia online España
DouglasPar on said:
http://ucipediatriatoledo.com/# Viagra precio sin receta
BrandonavaVy on said:
https://lacefieldurology.com/# buy ed pills online
WilliamAmuro on said:
Farmacias baratas online envío gratis Farmacias baratas online envío gratis Farmacia online envío gratis
DouglasPar on said:
https://pediatraefrainvillalobos.com/# Farmacia online España
ArthurTef on said:
ed treatment online: Dr Lacefield – overseas pharmacy no prescription
BrandonavaVy on said:
http://lacefieldurology.com/# ed pills
ArthurTef on said:
Comprar Viagra en España: Viagra genérica sin receta – UCI Pediatría Toledo
BrandonavaVy on said:
https://ucipediatriatoledo.com/# Comprar Viagra en farmacia sin receta
DouglasPar on said:
https://lacefieldurology.com/# discount ed pills
WilliamAmuro on said:
edmeds Urology Dr Lacefield medstore online pharmacy
DouglasPar on said:
https://pediatraefrainvillalobos.com/# farmacia online
BrandonavaVy on said:
https://pediatraefrainvillalobos.com/# Farmacia online envío gratis
ArthurTef on said:
viagra: UCI Pediatría Toledo – UCI Pediatría Toledo
ArthurTef on said:
Viagra genérico precio: Comprar Viagra original online – Comprar Viagra en España
BrandonavaVy on said:
https://ucipediatriatoledo.com/# UCI Pediatría
DouglasPar on said:
https://lacefieldurology.shop/# where to get ed pills
WilliamAmuro on said:
farmacia online barata farmacia online Farmacia online España
BrandonavaVy on said:
https://pediatraefrainvillalobos.shop/# Efrain Villalobos Verduzco
DouglasPar on said:
https://pediatraefrainvillalobos.com/# Farmacia online España
ArthurTef on said:
where can i buy erectile dysfunction pills: Lacefield – new pharmacy online
BrandonavaVy on said:
https://lacefieldurology.com/# buy ed medication online
ArthurTef on said:
farmacia online: farmacia barata – Farmacia online España
DouglasPar on said:
http://lacefieldurology.com/# online ed treatments
BrandonavaVy on said:
https://lacefieldurology.shop/# buy ed medication online
WilliamAmuro on said:
how to get ed meds online Urology Dr Lacefield trusted online pharmacy
DouglasPar on said:
http://lacefieldurology.com/# low cost ed medication
ArthurTef on said:
UCI Pediatría: Comprar Viagra en farmacia sin receta – Comprar Viagra en farmacia sin receta
BrandonavaVy on said:
http://lacefieldurology.com/# п»їed pills online
ArthurTef on said:
Comprar Viagra en farmacia sin receta: UCI Pediatría – Comprar Viagra en farmacia sin receta
DouglasPar on said:
https://lacefieldurology.shop/# ed pills cheap
BrandonavaVy on said:
https://ucipediatriatoledo.com/# Comprar Viagra
WilliamAmuro on said:
farmacia barata Farmacia online envío gratis farmacia online barata
DouglasPar on said:
https://ucipediatriatoledo.shop/# Viagra genérico precio
ArthurTef on said:
ed treatments online: Lacefield Urology – online pharmacy no prescription needed
BrandonavaVy on said:
https://ucipediatriatoledo.com/# UCI Pediatría
ArthurTef on said:
Comprar Viagra en farmacia sin receta: Viagra genérica sin receta – Comprar Viagra
BrandonavaVy on said:
https://lacefieldurology.shop/# online ed drugs
DouglasPar on said:
https://pediatraefrainvillalobos.com/# Efrain Villalobos Verduzco
BrandonavaVy on said:
https://lacefieldurology.com/# online prescription for ed
DouglasPar on said:
http://lacefieldurology.com/# ed meds online
ArthurTef on said:
farmacia online barata: Farmacias baratas online envío gratis – Pediatra Efrain Villalobos
ArthurTef on said:
UCI Pediatría Toledo: UCI Pediatría – Viagra genérico precio
BrandonavaVy on said:
https://pediatraefrainvillalobos.shop/# Farmacias baratas online envío gratis
DouglasPar on said:
http://ucipediatriatoledo.com/# UCI Pediatría
BrandonavaVy on said:
http://ucipediatriatoledo.com/# Comprar Viagra en España
DouglasPar on said:
http://ucipediatriatoledo.com/# Viagra genérica sin receta
WilliamAmuro on said:
Pediatra Efrain Villalobos Farmacia online envío gratis Farmacia online España
ArthurTef on said:
Farmacias baratas online envío gratis: Farmacia online España – Farmacia online España
BrandonavaVy on said:
https://pediatraefrainvillalobos.shop/# Farmacia online España
ArthurTef on said:
Farmacia online España: Efrain Villalobos Verduzco – farmacia barata
DouglasPar on said:
http://pediatraefrainvillalobos.com/# Farmacia online España
BrandonavaVy on said:
https://ucipediatriatoledo.shop/# UCI Pediatría Toledo
DouglasPar on said:
http://pediatraefrainvillalobos.com/# Pediatra Efrain Villalobos
ArthurTef on said:
Farmacia online España: Efrain Villalobos Verduzco – Farmacia online España
BrandonavaVy on said:
https://ucipediatriatoledo.com/# viagra
WilliamAmuro on said:
Farmacia online envío gratis Farmacia online España farmacia online barata
ArthurTef on said:
Comprar Viagra: Comprar Viagra – Comprar Viagra original online
DouglasPar on said:
https://pediatraefrainvillalobos.com/# Farmacia online envío gratis
BrandonavaVy on said:
http://ucipediatriatoledo.com/# Viagra precio sin receta
DouglasPar on said:
https://ucipediatriatoledo.com/# viagra
ArthurTef on said:
Comprar Viagra: Viagra genérico precio – Comprar Viagra online seguro
BrandonavaVy on said:
https://lacefieldurology.shop/# erectile dysfunction online
ArthurTef on said:
online ed medicine: Lacefield Urology – legal online pharmacies in the us
WilliamAmuro on said:
Pediatra Efrain Villalobos Pediatra Efrain Villalobos Efrain Villalobos Verduzco
BrandonavaVy on said:
http://ucipediatriatoledo.com/# viagra
DouglasPar on said:
https://lacefieldurology.com/# cheap ed pills
DouglasPar on said:
https://ucipediatriatoledo.com/# Comprar Viagra
BrandonavaVy on said:
http://pediatraefrainvillalobos.com/# farmacia barata
ArthurTef on said:
UCI Pediatría Toledo: Viagra genérica sin receta – Comprar Viagra en España
ArthurTef on said:
Comprar Viagra: UCI Pediatría Toledo – UCI Pediatría
BrandonavaVy on said:
https://lacefieldurology.shop/# online ed medications
DouglasPar on said:
https://lacefieldurology.com/# ed online pharmacy
BrandonavaVy on said:
http://lacefieldurology.com/# cheap erectile dysfunction pills
WilliamAmuro on said:
UCI Pediatría Viagra precio sin receta Viagra precio sin receta
ArthurTef on said:
erectile dysfunction meds online: Dr Lacefield – worldwide pharmacy online
BrandonavaVy on said:
https://ucipediatriatoledo.shop/# Comprar Viagra en farmacia sin receta
ArthurTef on said:
Comprar Viagra online seguro: Viagra genérico precio – viagra
DouglasPar on said:
https://ucipediatriatoledo.com/# UCI Pediatría
BrandonavaVy on said:
http://lacefieldurology.com/# ed doctor online
DouglasPar on said:
http://lacefieldurology.com/# cheap ed drugs
WilliamAmuro on said:
Pediatra Efrain Villalobos Farmacia online España farmacia online barata
BrandonavaVy on said:
https://ucipediatriatoledo.shop/# UCI Pediatría Toledo
ArthurTef on said:
ed medications online: Lacefield – online pharmacy no prescription needed
ArthurTef on said:
Efrain Villalobos Verduzco: Efrain Villalobos Verduzco – Farmacia online envío gratis
DouglasPar on said:
http://lacefieldurology.com/# low cost ed pills
BrandonavaVy on said:
http://ucipediatriatoledo.com/# Comprar Viagra en España
DouglasPar on said:
http://ucipediatriatoledo.com/# Viagra precio sin receta
BrandonavaVy on said:
https://pediatraefrainvillalobos.shop/# Efrain Villalobos Verduzco
ArthurTef on said:
ed med online: Urology Dr Lacefield – best online pharmacy no prescription
ArthurTef on said:
Farmacia online envío gratis: Pediatra Efrain Villalobos – Farmacias baratas online envío gratis
WilliamAmuro on said:
Viagra genérico precio Comprar Viagra en farmacia sin receta Comprar Viagra online seguro
BrandonavaVy on said:
http://lacefieldurology.com/# online erectile dysfunction medication
DouglasPar on said:
https://pediatraefrainvillalobos.com/# Efrain Villalobos Verduzco
BrandonavaVy on said:
https://pediatraefrainvillalobos.com/# Farmacia online envío gratis
DouglasPar on said:
https://pediatraefrainvillalobos.com/# Farmacia online envío gratis
ArthurTef on said:
Farmacias baratas online envío gratis: Farmacia online España – Pediatra Efrain Villalobos
BrandonavaVy on said:
https://lacefieldurology.shop/# cheap ed
ArthurTef on said:
cheap ed medicine: Urology Dr Lacefield – worldwide pharmacy online
DouglasPar on said:
https://pediatraefrainvillalobos.com/# Farmacias baratas online envío gratis
WilliamAmuro on said:
Comprar Viagra en España Viagra genérico precio Viagra precio sin receta
BrandonavaVy on said:
http://lacefieldurology.com/# cheap ed treatment
DouglasPar on said:
http://pediatraefrainvillalobos.com/# farmacia barata
Jerrywhall on said:
https://sildfrancedelivery.icu/# Le gГ©nГ©rique de Viagra
FrankBus on said:
farmacias online usa: farmacia mexicana en chicago – mexico pharmacy list
MatthewCat on said:
https://mexicanusarx.online/# mexico pharmacy order online
Jerrywhall on said:
https://vgrfrancepharm.online/# Viagra homme prix en pharmacie sans ordonnance
MatthewCat on said:
https://mexicanusarx.online/# mexico city pharmacy
RickeyPiogs on said:
https://mexicanusarx.online/# buy drugs online
Jerrywhall on said:
https://mexicomedsrx.online/# mexican pharmacy near me
FrankBus on said:
legitimate mexican pharmacy online: mexican medicine – mexico drug store online
Jerrywhall on said:
https://sildenafilsansordonnance.online/# Acheter Sildenafil 100mg sans ordonnance
MatthewCat on said:
https://mexicanusarx.online/# mexico rx
FrankBus on said:
Viagra Pfizer sans ordonnance: Viagra 100mg prix – Viagra en france livraison rapide
Jerrywhall on said:
https://mexicanusarx.online/# pharmacys in mexico
MatthewCat on said:
https://mexicanusarx.online/# mexican pharmacy online
RickeyPiogs on said:
https://sildfrancedelivery.icu/# Viagra pas cher livraison rapide france
FrankBus on said:
Acheter Sildenafil 100mg sans ordonnance: Viagra pas cher inde – Viagra gГ©nГ©rique pas cher livraison rapide
Jerrywhall on said:
https://mexicanfastdelivery.top/# medication in mexico
MatthewCat on said:
https://mexicanusarx.online/# mexican rx pharm
FrankBus on said:
Viagra homme prix en pharmacie sans ordonnance: Viagra sans ordonnance 24h suisse – Viagra homme prix en pharmacie sans ordonnance
Jerrywhall on said:
https://mexicanfastdelivery.top/# online drugs order
MatthewCat on said:
https://mexicanusarx.online/# mail order pharmacies
Jerrywhall on said:
https://sildfrancedelivery.icu/# Viagra homme prix en pharmacie
FrankBus on said:
Viagra homme sans prescription: Viagra homme sans prescription – Viagra pas cher livraison rapide france
MatthewCat on said:
https://sildenafilsansordonnance.online/# Viagra homme prix en pharmacie sans ordonnance
RickeyPiogs on said:
https://mexicanusarx.online/# purple pharmacy mexico
FrankBus on said:
best mexican online pharmacy: mexican pharmacy online medications – mexico pharmacy online
Jerrywhall on said:
https://sildenafilsansordonnance.online/# SildГ©nafil 100mg pharmacie en ligne
MatthewCat on said:
https://sildfrancedelivery.icu/# Viagra pas cher livraison rapide france
Jerrywhall on said:
https://mexicomedsrx.online/# mexipharmacy reviews
FrankBus on said:
mexico pharmacy order online: mexican pharmacies online – my mexican pharmacy
Jerrywhall on said:
https://vgrfrancepharm.online/# Viagra homme prix en pharmacie sans ordonnance
MatthewCat on said:
https://mexicanfastdelivery.top/# mexican mail order pharmacy
FrankBus on said:
Viagra Pfizer sans ordonnance: Viagra gГ©nГ©rique pas cher livraison rapide – SildГ©nafil 100mg pharmacie en ligne
RickeyPiogs on said:
https://mexicomedsrx.online/# mexican online mail order pharmacy
MatthewCat on said:
https://vgrfrancepharm.online/# SildГ©nafil 100 mg sans ordonnance
Jerrywhall on said:
https://mexicanusarx.online/# mexican pharma
Jerrywhall on said:
https://mexicanfastdelivery.top/# pharmacies in mexico that ship to the us
FrankBus on said:
medication from mexico: medication in mexico – order antibiotics from mexico
FrankBus on said:
order meds from mexico: best pharmacy in mexico – medications can i buy mexico
Jerrywhall on said:
https://mexicomedsrx.online/# medicine mexico
MatthewCat on said:
https://sildenafilsansordonnance.online/# SildГ©nafil Teva 100 mg acheter
RickeyPiogs on said:
https://mexicomedsrx.online/# farmacias online usa
Jerrywhall on said:
https://mexicomedsrx.online/# farmacia online usa
FrankBus on said:
Viagra Pfizer sans ordonnance: Viagra sans ordonnance livraison 24h – Viagra vente libre pays
MatthewCat on said:
https://mexicanusarx.online/# mexican pharmacys
Jerrywhall on said:
https://mexicanusarx.online/# mexican pharmacy menu
FrankBus on said:
farmacia online usa: progreso mexico pharmacy online – purple pharmacy
MatthewCat on said:
https://mexicanusarx.online/# best mexican pharmacy online
Jerrywhall on said:
https://vgrfrancepharm.online/# Viagra vente libre allemagne
RickeyPiogs on said:
https://vgrfrancepharm.online/# SildГ©nafil 100 mg sans ordonnance
FrankBus on said:
Viagra femme sans ordonnance 24h: Prix du Viagra en pharmacie en France – SildГ©nafil 100 mg sans ordonnance
MatthewCat on said:
https://mexicanfastdelivery.top/# mexipharmacy reviews
Jerrywhall on said:
https://mexicanfastdelivery.top/# reputable mexican pharmacy
FrankBus on said:
farmacia pharmacy mexico: mexi pharmacy – mexican pharmacy prices
MatthewCat on said:
https://vgrfrancepharm.online/# Sildenafil teva 100 mg sans ordonnance
Jerrywhall on said:
https://vgrfrancepharm.online/# Acheter viagra en ligne livraison 24h
Allenzed on said:
https://clinicalpathiver.com/# stromectol
Altonunlom on said:
ClinicalPathIver: stromectol for sale – ClinicalPathIver
AndrewTok on said:
ClinicalPathIver: stromectol 3mg cost – stromectol
LutherGlade on said:
ClinicalPathIver stromectol tablets ClinicalPathIver
AndrewTok on said:
can i buy cheap clomid without prescription: CycleCareClomid – order cheap clomid for sale
Allenzed on said:
https://farmaciacaman.com/# migliori farmacie online 2024
LutherGlade on said:
CycleCareClomid CycleCareClomid can i buy clomid without rx
Allenzed on said:
https://farmaciacaman.online/# farmacie online autorizzate elenco
Altonunlom on said:
CycleCareClomid: generic clomid without prescription – CycleCareClomid
AndrewTok on said:
comprare farmaci online all’estero: Farmacie online sicure – trusted online pharmacy
LutherGlade on said:
Farmacia online piГ№ conveniente farmacia online best mail order pharmacy
Allenzed on said:
https://farmaciacaman.com/# acquisto farmaci con ricetta
AndrewTok on said:
comprare farmaci online con ricetta: FarmaciaCaman – online pharmacy no prescription needed
Allenzed on said:
https://cyclecareclomid.com/# how to get generic clomid pill
LutherGlade on said:
where can i get clomid without rx where to get clomid without insurance where can i get cheap clomid
Altonunlom on said:
buying cheap clomid without dr prescription: get generic clomid tablets – CycleCareClomid
AndrewTok on said:
п»їFarmacia online migliore: farmacie online affidabili – worldwide pharmacy online
Allenzed on said:
https://cyclecareclomid.shop/# where can i get cheap clomid without insurance
AndrewTok on said:
purchase stromectol online: ClinicalPathIver – ivermectin purchase
LutherGlade on said:
cost clomid no prescription CycleCareClomid cost of clomid pills
Allenzed on said:
https://cyclecareclomid.shop/# CycleCareClomid
LutherGlade on said:
stromectol medication ivermectin ebay ClinicalPathIver
Altonunlom on said:
ClinicalPathIver: ivermectin cost uk – ClinicalPathIver
Allenzed on said:
http://cyclecareclomid.com/# CycleCareClomid
AndrewTok on said:
can i purchase clomid now: CycleCareClomid – cost of clomid pills
AndrewTok on said:
comprare farmaci online con ricetta: п»їFarmacia online migliore – pharmacy online
Allenzed on said:
http://clinicalpathiver.com/# ClinicalPathIver
LutherGlade on said:
stromectol for humans ClinicalPathIver ClinicalPathIver
Allenzed on said:
http://cyclecareclomid.com/# CycleCareClomid
LutherGlade on said:
get clomid online where can i get clomid tablets CycleCareClomid
AndrewTok on said:
CycleCareClomid: where can i get generic clomid no prescription – where to buy cheap clomid without prescription
Altonunlom on said:
where to get clomid pills: how to buy cheap clomid without prescription – CycleCareClomid
Allenzed on said:
https://clinicalpathiver.com/# ivermectin price uk
AndrewTok on said:
where to get generic clomid without rx: buy cheap clomid price – where to get clomid without insurance
LutherGlade on said:
stromectol medication stromectol generic ClinicalPathIver
Allenzed on said:
https://clinicalpathiver.com/# ClinicalPathIver
LutherGlade on said:
ivermectin pill cost ivermectin 10 ml stromectol price
AndrewTok on said:
farmacie online autorizzate elenco: FarmaciaCaman – medicine online order
Altonunlom on said:
farmacie online sicure: п»їFarmacia online migliore – pharmacy order online
Allenzed on said:
https://farmaciacaman.com/# acquisto farmaci con ricetta
AndrewTok on said:
CycleCareClomid: order cheap clomid – CycleCareClomid
LutherGlade on said:
buying cheap clomid no prescription CycleCareClomid CycleCareClomid
Allenzed on said:
http://cyclecareclomid.com/# CycleCareClomid
LutherGlade on said:
CycleCareClomid can i get generic clomid without a prescription CycleCareClomid
Allenzed on said:
https://farmaciacaman.com/# farmacia online piГ№ conveniente
AndrewTok on said:
CycleCareClomid: cost generic clomid without insurance – buy clomid
Altonunlom on said:
ivermectin buy online: ClinicalPathIver – ClinicalPathIver
AndrewTok on said:
farmacie online autorizzate elenco: acquistare farmaci senza ricetta – top-rated online pharmacies
Allenzed on said:
https://clinicalpathiver.com/# ivermectin purchase
LutherGlade on said:
ivermectin over the counter canada ClinicalPathIver ClinicalPathIver
Allenzed on said:
https://clinicalpathiver.com/# ClinicalPathIver
LutherGlade on said:
ClinicalPathIver ClinicalPathIver ClinicalPathIver
AndrewTok on said:
п»їFarmacia online migliore: farmaci senza ricetta elenco – online pharmacy without prescription
Altonunlom on said:
CycleCareClomid: can i buy generic clomid no prescription – can you get cheap clomid no prescription
AndrewTok on said:
п»їFarmacia online migliore: farmacie online sicure – legitimate online pharmacy
Allenzed on said:
http://cyclecareclomid.com/# CycleCareClomid
LutherGlade on said:
stromectol ivermectin ClinicalPathIver ivermectin for humans
Allenzed on said:
http://farmaciacaman.com/# farmacie online autorizzate elenco
LutherGlade on said:
stromectol generic ClinicalPathIver stromectol generic
Allenzed on said:
http://cyclecareclomid.com/# CycleCareClomid
Altonunlom on said:
ClinicalPathIver: ClinicalPathIver – ClinicalPathIver
AndrewTok on said:
farmacia online senza ricetta: FarmaciaCaman – online pharmacy no prescription
Allenzed on said:
https://cyclecareclomid.com/# where buy clomid without insurance
LutherGlade on said:
CycleCareClomid CycleCareClomid can i get generic clomid pills
AndrewTok on said:
farmacia online piГ№ conveniente: farmacia online piГ№ conveniente – online pharmacy without prescription
LutherGlade on said:
ClinicalPathIver purchase stromectol online ClinicalPathIver
Allenzed on said:
http://clinicalpathiver.com/# ivermectin where to buy for humans
Altonunlom on said:
farmacia online senza ricetta: Farmacia online miglior prezzo – online pharmacy no prescription
Allenzed on said:
https://farmaciacaman.com/# п»їFarmacia online migliore
LutherGlade on said:
Farmacie online sicure FarmaciaCaman top online pharmacy
Allenzed on said:
http://cyclecareclomid.com/# can i get clomid without insurance
LutherGlade on said:
farmacia online piГ№ conveniente FarmaciaCaman foreign online pharmacy
AndrewTok on said:
acquisto farmaci con ricetta: migliori farmacie online 2024 – best rx pharmacy online
Altonunlom on said:
stromectol tablets: stromectol 3 mg dosage – ivermectin 5 mg price
Allenzed on said:
http://clinicalpathiver.com/# ClinicalPathIver
LutherGlade on said:
acquistare farmaci senza ricetta Farmacia online miglior prezzo buy drugs online
Allenzed on said:
https://clinicalpathiver.shop/# ClinicalPathIver
AndrewTok on said:
CycleCareClomid: CycleCareClomid – CycleCareClomid
LutherGlade on said:
CycleCareClomid cost clomid no prescription where can i get clomid without rx
AndrewTok on said:
Farmacia online miglior prezzo: FarmaciaCaman – us pharmacy no prescription
Allenzed on said:
http://farmaciacaman.com/# acquisto farmaci con ricetta
Altonunlom on said:
ClinicalPathIver: stromectol coronavirus – ivermectin 50 mg
Allenzed on said:
https://cyclecareclomid.shop/# CycleCareClomid
LutherGlade on said:
ClinicalPathIver ClinicalPathIver ClinicalPathIver
AndrewTok on said:
ClinicalPathIver: ClinicalPathIver – ClinicalPathIver
Allenzed on said:
https://farmaciacaman.com/# farmacie online autorizzate elenco
AndrewTok on said:
acquistare farmaci senza ricetta: farmacie online sicure – trusted online pharmacy
LutherGlade on said:
order generic clomid pills CycleCareClomid CycleCareClomid
Allenzed on said:
https://cyclecareclomid.shop/# CycleCareClomid
Altonunlom on said:
top farmacia online: Farmacie on line spedizione gratuita – online pharmacy
LutherGlade on said:
can i get cheap clomid no prescription CycleCareClomid clomid tablet
Allenzed on said:
http://cyclecareclomid.com/# where to get cheap clomid without a prescription
AndrewTok on said:
Farmacia online piГ№ conveniente: farmacie online sicure – п»їinternational drug mart
Davidses on said:
https://doctortopfrance.icu/# SildГ©nafil 100 mg sans ordonnance
Michaelpeace on said:
reputable mexican pharmacy order antibiotics from mexico mexican pharmacy ship to usa
Davidses on said:
https://mexicandoctorate.top/# order medicine from mexico
JustinDed on said:
Viagra sans ordonnance livraison 48h: Viagra sans ordonnance 24h suisse – Viagra homme prix en pharmacie sans ordonnance
JustinDed on said:
Viagra vente libre pays: Viagra pas cher paris – Viagra homme prix en pharmacie sans ordonnance
Davidses on said:
https://mexicotoppharmacy.icu/# tijuana pharmacy online
Harriszes on said:
https://mexicandoctortous.online/# mexipharmacy reviews
Davidses on said:
https://vgrsansordonnance.online# SildГ©nafil Teva 100 mg acheter
Michaelpeace on said:
Viagra homme prix en pharmacie sans ordonnance Viagra sans ordonnance livraison 48h SildГ©nafil 100 mg prix en pharmacie en France
JustinDed on said:
SildГ©nafil 100 mg sans ordonnance: п»їViagra sans ordonnance 24h – Viagra pas cher inde
Harriszes on said:
https://mexicotoppharmacy.icu/# mexican pharmacies
Davidses on said:
https://doctortopfrance.icu/# SildГ©nafil 100mg pharmacie en ligne
JustinDed on said:
Viagra sans ordonnance pharmacie France: SildГ©nafil 100mg pharmacie en ligne – Prix du Viagra en pharmacie en France
Davidses on said:
https://mexicandoctortous.online/# mexico online farmacia
Michaelpeace on said:
Viagra prix pharmacie paris Viagra 100mg prix Viagra vente libre pays
JustinDed on said:
farmacia mexicana online: online pharmacy in mexico – mexican pharmacies online
Davidses on said:
https://doctortopfrance.icu/# Viagra vente libre allemagne
JustinDed on said:
mexico pharmacy price list: pharmacia mexico – order antibiotics from mexico
Davidses on said:
https://doctortopfrance.icu/# Meilleur Viagra sans ordonnance 24h
Harriszes on said:
https://vgrsansordonnance.top/# Viagra sans ordonnance pharmacie France
Davidses on said:
https://vgrsansordonnance.top/# Quand une femme prend du Viagra homme
JustinDed on said:
SildГ©nafil 100 mg sans ordonnance: Viagra pas cher livraison rapide france – Viagra prix pharmacie paris
Harriszes on said:
https://doctortopfrance.icu/# Prix du Viagra en pharmacie en France
JustinDed on said:
pharmacies in mexico that ship to the us: mexican drugstore – pharmacy mexico online
Davidses on said:
https://mexicandoctorate.top/# mexican pharmacy that ships to the us
Davidses on said:
https://mexicotoppharmacy.icu/# п»їmexican pharmacy
Michaelpeace on said:
п»їViagra sans ordonnance 24h Viagra gГ©nГ©rique pas cher livraison rapide Prix du Viagra en pharmacie en France
JustinDed on said:
Viagra 100mg prix: Prix du Viagra 100mg en France – SildГ©nafil 100 mg prix en pharmacie en France
Davidses on said:
https://mexicandoctorate.top/# mail order pharmacy mexico
JustinDed on said:
Viagra gГ©nГ©rique sans ordonnance en pharmacie: Viagra femme sans ordonnance 24h – Viagra 100 mg sans ordonnance
Harriszes on said:
https://doctortopfrance.icu/# Viagra pas cher livraison rapide france
Davidses on said:
https://mexicotoppharmacy.icu/# farmacia mexicana en chicago
JustinDed on said:
Viagra pas cher livraison rapide france: Quand une femme prend du Viagra homme – Viagra pas cher livraison rapide france
Davidses on said:
https://mexicandoctortous.online/# farmacia online usa
Michaelpeace on said:
los algodones pharmacy online mexican pharmacies mexican pharmacy ship to usa
Harriszes on said:
https://mexicandoctortous.online/# mexican pharmacies online
JustinDed on said:
Viagra pas cher inde: Prix du Viagra 100mg en France – Viagra homme prix en pharmacie sans ordonnance
Davidses on said:
https://vgrsansordonnance.top/# Le gГ©nГ©rique de Viagra
Davidses on said:
https://vgrsansordonnance.top/# Viagra sans ordonnance livraison 48h
JustinDed on said:
mexican medicine: mexicanrxpharm – mexican rx pharm
Michaelpeace on said:
farmacias online usa affordable pharmacy mexico medication
JustinDed on said:
Viagra Pfizer sans ordonnance: Quand une femme prend du Viagra homme – Viagra gГ©nГ©rique sans ordonnance en pharmacie
Davidses on said:
https://mexicandoctortous.online/# pharmacia mexico
Harriszes on said:
https://mexicotoppharmacy.icu/# buying prescriptions in mexico
Davidses on said:
https://mexicotoppharmacy.icu/# mexican pharmacies that ship to us
JustinDed on said:
SildГ©nafil Teva 100 mg acheter: Viagra vente libre allemagne – Viagra gГ©nГ©rique sans ordonnance en pharmacie
Davidses on said:
https://mexicandoctortous.online/# mexican rx
Harriszes on said:
https://mexicotoppharmacy.icu/# mexico meds
JustinDed on said:
mail order pharmacies: mexican pharmacies online drugs – legitimate mexican pharmacy online
Michaelpeace on said:
Le gГ©nГ©rique de Viagra Viagra en france livraison rapide Sildenafil teva 100 mg sans ordonnance
Davidses on said:
https://vgrsansordonnance.online# Viagra gГ©nГ©rique pas cher livraison rapide